Emuluxe Platform Setup Guide
This comprehensive guide walks you through the complete process of setting up and using the Emuluxe Platform (app.emuluxe.com). The Platform is the professional hub for advanced simulation, AI audits, and team collaboration, designed for teams, security researchers, and QA engineers who require features beyond standard browser-level testing.
Prerequisites
Before beginning the setup process, ensure you have:
- Active Internet Connection: Required for all Platform features
- Modern Browser: Chrome 110+, Firefox 115+, Safari 16+, or Edge 110+
- Emuluxe Account: Sign up at app.emuluxe.com
- Subscription: Pro or Enterprise plan (Platform features require paid subscription)
- Team Access (for Enterprise): Team administrator credentials for SSO setup
Platform Overview
The Emuluxe Platform provides advanced capabilities not available in the Chrome Extension:
- Parallel Simulation: Test your website on multiple devices simultaneously
- AI-Powered Audits: Deep architectural analysis with WCAG, performance, and accessibility checks
- Session Management: Save, share, and export complete simulation states
- Advanced Network Control: Custom latency profiles and server-side traffic mirroring
- Team Collaboration: Shared workspaces, team dashboards, and audit logs
- Enterprise Features: SSO, usage analytics, and compliance logging
Account Setup and Registration
Step 1: Create Your Account
- Navigate to app.emuluxe.com
- Click the "Sign Up" button in the top-right corner
- Choose your registration method:
- Email: Enter your email address and create a password
- Google OAuth: Sign in with your Google account
- GitHub OAuth: Sign in with your GitHub account
- Complete the registration form with:
- Full Name: For account identification
- Email Address: For notifications and account recovery
- Password: Minimum 12 characters with mixed case, numbers, and symbols
- Organization Name: For team accounts and billing
- Click "Create Account" to proceed
Step 2: Email Verification
- After registration, check your email for a verification message from Emuluxe
- Click the "Verify Email" button in the email
- You'll be redirected to the Emuluxe Platform dashboard
- If you don't receive the email within 5 minutes:
- Check your spam folder
- Click "Resend Verification" on the login page
- Contact support if issues persist
Step 3: Select Your Subscription Plan
- After verification, you'll see the plan selection page
- Choose from three tiers:
Free Tier (for evaluation)
- 6 device profiles
- 3 AI analyses per day
- Basic simulation features
- No session management
- No team features
Pro Tier ($9/month)
- 30+ device profiles
- Unlimited AI analyses
- Session saving and sharing
- Advanced network profiles
- Parallel simulation (up to 4 devices)
- Priority support
Enterprise Tier ($99/month)
- All Pro features
- Unlimited parallel simulation
- Team dashboards and analytics
- Enterprise SSO (SAML, OIDC)
- Audit and compliance logs
- Custom device profiles
- Dedicated support
- Click "Select Plan" on your chosen tier
- Enter payment information (Pro and Enterprise only)
- Confirm your subscription
Step 4: Complete Your Profile
- Navigate to Settings → Profile
- Complete your profile information:
- Avatar: Upload a profile picture
- Time Zone: For accurate session timestamps
- Notification Preferences: Email, in-app, and push notifications
- API Key: Generate for programmatic access
- Click "Save Changes" to update your profile
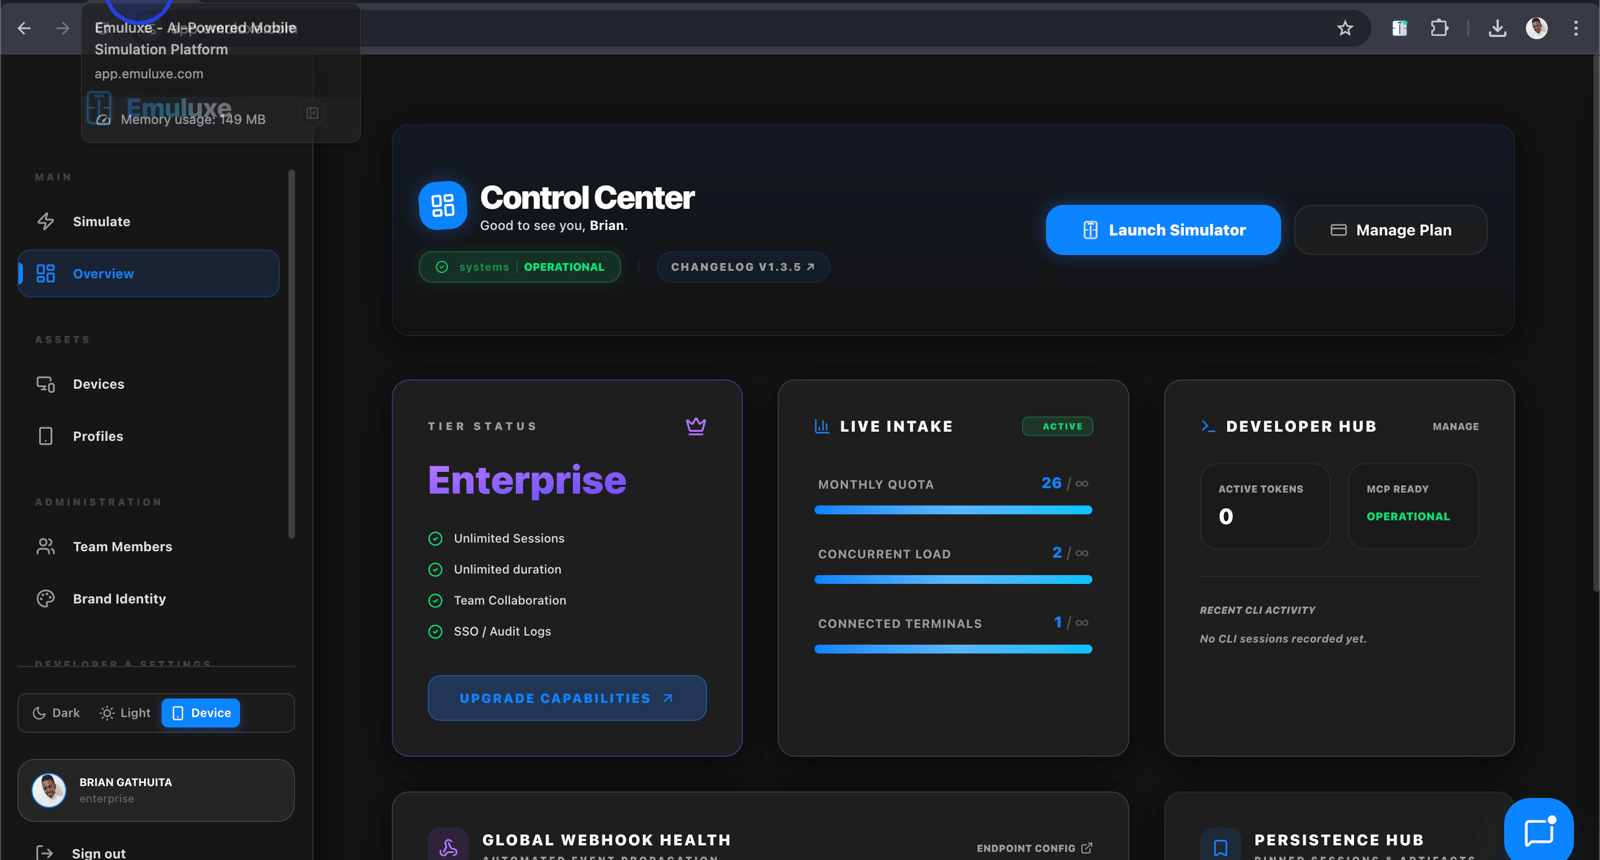
Dashboard Navigation
Understanding the Dashboard Layout
The Emuluxe Platform dashboard consists of several key sections:
Left Sidebar
- Simulation: Main simulation interface
- Sessions: Saved simulation states
- Devices: Device fleet management
- Network: Network profiles and throttling
- AI Analysis: AI-powered audits and diagnostics
- Team: Team management (Enterprise only)
- Analytics: Usage and performance metrics
- Settings: Account and configuration settings
Top Navigation Bar
- Logo: Return to dashboard home
- Project Selector: Switch between projects
- User Menu: Profile, billing, and logout
- Help: Documentation and support links
Main Content Area
- Quick Actions: Frequently used features
- Recent Sessions: Your latest simulation sessions
- Activity Feed: Recent actions and team activity
- Feature Highlights: New features and tips
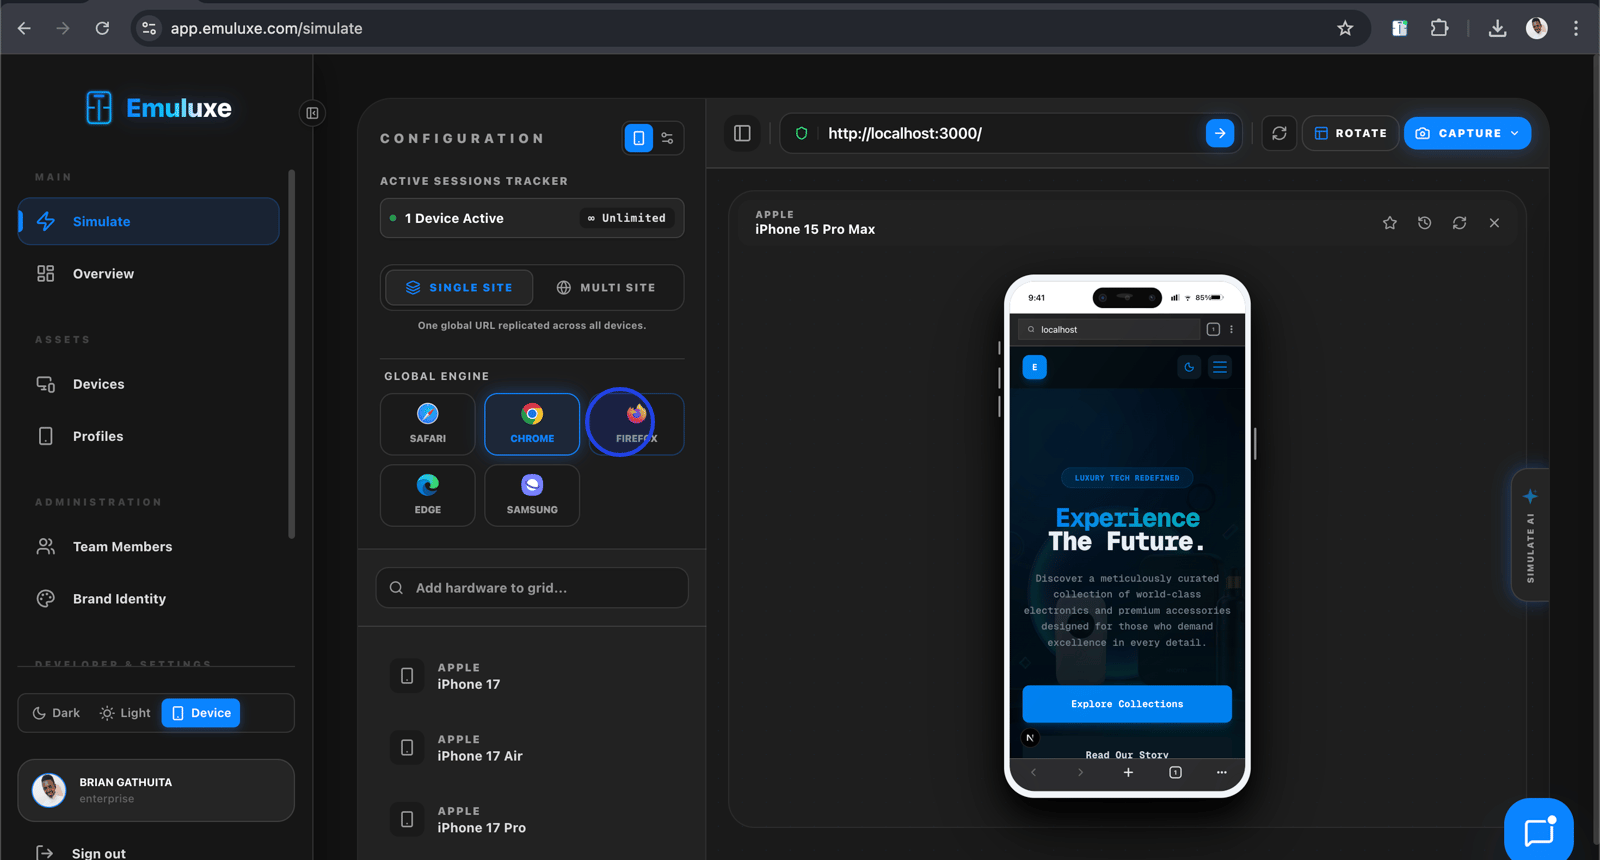
Creating Your First Simulation
Step 5: Navigate to the Simulation Interface
- Click "Simulation" in the left sidebar
- The simulation interface loads with the Foundry panel
- The Foundry panel displays:
- URL Input: Enter the website URL to simulate
- Device Selector: Choose from available device profiles
- Quick Actions: Common simulation controls
- Recent Simulations: Quick access to recent URLs
Step 6: Enter Your Target URL
- In the URL input field, enter the website you want to test:
- Production URLs:
https://example.com - Localhost:
http://localhost:3000(requires local tunnel for remote testing) - Staging URLs:
https://staging.example.com
- Production URLs:
- The platform validates the URL format
- Click "Analyze URL" to pre-fetch site information
- The platform displays:
- Site Title: Extracted from the page
- Technologies: Detected frameworks and libraries
- Mobile-Friendly: Basic mobile compatibility check
Step 7: Select Device Configuration
Single Device Mode
- In the device selector, choose a single device profile
- Available categories:
- iPhone: SE, 14, 15, 15 Pro, 15 Pro Max
- iPad: mini 6, Pro 12.9, Air
- Android Flagship: Pixel 8 Pro, Galaxy S24 Ultra, OnePlus 12
- Android Mid-Range: Galaxy A54, Pixel 7a
- Android Budget: Redmi Note 13, Moto G Power
- Foldables: Galaxy Z Fold 6, Pixel Fold
- Desktop: MacBook Pro, Windows Laptop, 4K Display
- The device preview shows:
- Dimensions: Width, height, and pixel ratio
- User Agent: Mobile user agent string
- Features: Notch, dynamic island, home indicator support
Parallel Device Mode (Pro/Enterprise)
- Click the "Parallel Mode" toggle
- Select multiple devices (up to 4 for Pro, unlimited for Enterprise)
- Devices appear in a grid layout
- All devices load the same URL simultaneously
- Compare responsive behavior across devices in real-time
Step 8: Configure Simulation Settings
Network Configuration
- Click the "Network" dropdown in the Foundry panel
- Select from pre-configured profiles:
- Online: No throttling (default)
- 4G LTE: 10 Mbps down, 5 Mbps up, 100ms latency
- 3G: 1.5 Mbps down, 750 Kbps up, 200ms latency
- 2G: 250 Kbps down, 50 Kbps up, 500ms latency
- Offline: No connectivity
- For custom profiles (Enterprise):
- Click "Custom Profile"
- Specify download speed, upload speed, and latency
- Add jitter and packet loss for realistic simulation
- Save the profile for future use
System Appearance
- Toggle between Light and Dark mode
- The platform updates
prefers-color-schememedia query - Test your site's dark mode implementation
Orientation
- Select Portrait or Landscape orientation
- The viewport dimensions rotate accordingly
- Test critical flows in both orientations
Hardware Features
Enable or disable hardware simulation features:
- Device Frames: Show realistic device bezels and notches
- Safe Areas: Display safe area inset overlays
- Touch Simulation: Enable touch pointer and gestures
- Biometrics: Simulate FaceID/TouchID prompts (Pro/Enterprise)
- Geolocation: Override browser geolocation (Pro/Enterprise)
- Battery Status: Simulate battery level and charging state (Pro/Enterprise)
Step 9: Launch the Simulation
- Click the "Start Simulation" button
- The platform loads your URL in the selected device configuration
- The simulation panel appears with:
- Device Frame: Realistic device bezel with notch/dynamic island
- Viewport: The website rendered at mobile dimensions
- Control Bar: Simulation controls and status indicators
- Inspector: Chrome DevTools integration
- The simulation loads in the cloud, ensuring consistent performance
- For local development, use the local tunnel feature (see below)
Step 10: Using the Simulation Controls
Device Switching
- Click the device icon in the control bar
- Select a different device from the quick-pick menu
- The simulation reloads with the new device configuration
- Your current URL and scroll position are preserved
Orientation Toggle
- Click the rotate icon in the control bar
- The device frame rotates 90 degrees
- The viewport dimensions swap
- The website reflows according to responsive design
Screenshot Capture
- Click the camera icon in the control bar
- A high-fidelity screenshot is captured
- The screenshot includes:
- Device frame and bezels
- Rendered website content
- Current orientation and settings
- Screenshots are saved to your session gallery
Video Recording
- Click the record icon in the control bar
- Perform the actions you want to document
- Click stop to end recording
- The video downloads as an MP4 file
- Videos include device frame and all interactions
Inspector Access
- Click the inspector icon in the control bar
- Chrome DevTools opens in a dedicated panel
- Debug using standard DevTools features:
- Elements panel for DOM inspection
- Console for JavaScript debugging
- Network for request analysis
- Performance for profiling
Local Development Support
Step 11: Setting Up Local Tunnel
To test localhost URLs from the Platform:
- In the URL input, enter your local development server URL (e.g.,
http://localhost:3000) - Click the "Enable Tunnel" toggle
- The platform generates a secure tunnel URL
- Copy the tunnel URL and use it in your local development:
- Update your CORS settings to allow the tunnel domain
- Ensure your local server accepts requests from the tunnel
- The platform accesses your localhost through the encrypted tunnel
- Changes to your local code reflect immediately in the simulation
Step 12: Hot-Reload Configuration
For optimal local development workflow:
- Ensure your development server has hot-reload enabled (Vite, Webpack HMR, etc.)
- The platform automatically detects changes through the tunnel
- Modified files trigger automatic page refresh
- Your current device configuration and scroll position are preserved
- This provides a near-instant feedback loop
AI-Powered Analysis
Step 13: Running AI Analysis
The Platform's AI engine performs comprehensive audits:
Triggering Analysis
- With a simulation active, click the "Run AI Analysis" button
- Select analysis categories:
- Layout Shift: CLS and layout stability
- Performance: LCP, FID, and long tasks
- Accessibility: WCAG 2.1 compliance
- SEO: Meta tags, structured data, and crawlability
- Security: HTTPS, headers, and vulnerability checks
- Click "Start Analysis"
- The AI scans your page (typically 10-30 seconds depending on complexity)
- Results appear in a dedicated analysis panel
Understanding Analysis Results
Results are organized by category and severity:
Critical Issues
- Blocking the main thread for extended periods
- Critical accessibility violations (missing alt text, keyboard traps)
- Security vulnerabilities (mixed content, outdated libraries)
High Priority Issues
- Significant layout shifts (CLS > 0.25)
- Slow LCP (> 4 seconds)
- WCAG AA violations (color contrast, touch targets)
Medium Priority Issues
- Moderate layout shifts (CLS > 0.1)
- Suboptimal LCP (2.5-4 seconds)
- WCAG A violations
Low Priority Issues
- Minor layout shifts (CLS < 0.1)
- Acceptable LCP (< 2.5 seconds)
- Best practice recommendations
Implementing Fixes
- Click on any issue to see detailed information:
- Description: Clear explanation of the problem
- Location: CSS selector or file path
- Impact: How this affects user experience
- Code Snippet: Before/after code showing the fix
- Copy the suggested code snippet
- Apply the fix in your codebase
- Re-run analysis to verify the fix
- Track your progress in the analysis history
Session Management
Step 14: Saving a Session
Capture your complete simulation state:
- Configure your desired settings (device, network, orientation, etc.)
- Navigate to the specific URL and scroll position
- Click the "Save Session" button in the control bar
- Enter session details:
- Name: Descriptive name (e.g., "Checkout Flow - iPhone 15 Pro")
- Description: Additional context (optional)
- Tags: Organize with tags (e.g., "checkout", "mobile", "critical")
- Click "Save"
- The session is saved to your cloud storage
Step 15: Loading a Session
Restore a previously saved session:
- Navigate to Sessions in the left sidebar
- Browse your sessions by:
- Recent: Most recently saved
- Tags: Filter by tag
- Device: Filter by device profile
- Click on a session to load it
- The platform restores:
- URL and scroll position
- Device configuration
- Network settings
- Orientation and appearance
- Cookie and local storage state
Step 16: Sharing Sessions
Collaborate with team members:
- In the Sessions list, click the share icon next to a session
- Choose sharing method:
- Public Link: Anyone with the link can view
- Team Only: Only team members can access (Enterprise)
- Specific Users: Invite via email (Enterprise)
- Add optional notes for context
- Click "Generate Link" or "Send Invite"
- Recipients can load the exact simulation state you created
Step 17: Exporting Sessions
Export sessions for offline use or documentation:
- Select one or more sessions
- Click "Export"
- Choose export format:
- JSON: Machine-readable format for automation
- PDF: Visual report with screenshots
- HTML: Interactive HTML bundle
- The export downloads to your computer
- Use exports for:
- Documentation and reports
- Regression testing baselines
- Offline analysis
Team Collaboration (Enterprise)
Step 18: Setting Up Your Team
For Enterprise accounts, configure team access:
- Navigate to Team in the left sidebar
- Click "Invite Members"
- Enter email addresses for team members
- Assign roles:
- Admin: Full access to all features and settings
- Developer: Can create simulations and sessions
- Viewer: Read-only access to simulations and sessions
- Click "Send Invites"
- Team members receive email invitations to join
Step 19: Team Dashboard
Monitor team activity and usage:
- Navigate to Team → Dashboard
- View team metrics:
- Active Members: Current team size
- Simulations Run: Total simulations by team
- AI Analyses: AI analysis usage
- Session Storage: Storage usage and limits
- View activity feed:
- Recent simulations by team members
- Shared sessions
- AI analysis results
Step 20: Enterprise SSO Setup
Configure single sign-on for your organization:
- Navigate to Settings → SSO
- Choose SSO protocol:
- SAML 2.0: For most enterprise identity providers
- OIDC: For modern identity providers
- Configure your identity provider:
- Metadata URL: Or upload XML metadata file
- Entity ID: Your SSO identifier
- Assertion Consumer Service (ACS) URL: Provided by Emuluxe
- Map attributes:
- Email: User email attribute
- Name: User display name attribute
- Groups: Group membership for role assignment
- Click "Test Configuration" to verify
- Click "Enable SSO" to activate
Advanced Network Configuration
Step 21: Custom Network Profiles
Create realistic network conditions:
- Navigate to Network in the left sidebar
- Click "Create Custom Profile"
- Configure parameters:
- Download Speed: Bandwidth in Mbps or Kbps
- Upload Speed: Bandwidth in Mbps or Kbps
- Latency: Round-trip time in milliseconds
- Jitter: Latency variation in milliseconds
- Packet Loss: Percentage of packets lost
- TCP Window: TCP window size
- Name your profile (e.g., "Rural 4G", "Hotel WiFi")
- Click "Save Profile"
- Use custom profiles in simulation for realistic testing
Step 22: Network Traffic Mirroring
For Enterprise, mirror traffic to your servers:
- Navigate to Settings → Network Mirroring
- Enable traffic mirroring
- Configure mirror destination:
- Endpoint URL: Your server's endpoint
- Authentication: API key or certificate
- Filter: Which requests to mirror (all, API, static)
- Traffic from simulations is mirrored to your endpoint
- Use for:
- API testing and monitoring
- Security analysis
- Performance profiling
Device Fleet Management
Step 23: Managing Device Profiles
Organize your device fleet:
- Navigate to Devices in the left sidebar
- View all available device profiles
- Filter by:
- Category: iOS, Android, Desktop, Foldable
- Screen Size: Small, Medium, Large, Extra Large
- Popularity: Most used devices
- Star frequently used devices for quick access
- Hide devices you don't use
Step 24: Custom Device Profiles (Enterprise)
Create device profiles for your specific needs:
- Click "Create Custom Device"
- Specify device parameters:
- Name: Display name
- Width: Viewport width in pixels
- Height: Viewport height in pixels
- Device Pixel Ratio: Screen density
- User Agent: Custom user agent string
- Features: Notch, dynamic island, home indicator
- Upload device frame image (optional)
- Click "Save Device"
- Custom devices appear in your device selector
Analytics and Reporting
Step 25: Usage Analytics
Monitor your Platform usage:
- Navigate to Analytics in the left sidebar
- View usage metrics:
- Simulations Over Time: Graph of simulation activity
- Device Usage: Most frequently used devices
- Network Profiles: Network condition usage
- AI Analysis: Analysis frequency and results
- Filter by date range
- Export data as CSV for further analysis
Step 26: Performance Metrics
Track Platform performance:
- In Analytics, view performance metrics:
- Average Load Time: Time to start simulation
- AI Analysis Duration: Time to complete analysis
- Session Storage: Storage usage over time
- Identify bottlenecks
- Optimize your workflow based on data
API Access
Step 27: Generating API Keys
For programmatic access:
- Navigate to Settings → API Keys
- Click "Generate New Key"
- Name your key (e.g., "CI/CD Pipeline")
- Set permissions:
- Read: Access simulations and sessions
- Write: Create simulations and sessions
- Delete: Remove simulations and sessions
- Click "Generate"
- Copy the API key (store securely, it won't be shown again)
Step 28: Using the REST API
Make API calls to automate workflows:
# Create a simulation
curl -X POST https://api.emuluxe.com/v1/simulations \
  -H "Authorization: Bearer YOUR_API_KEY" \
  -H "Content-Type: application/json" \
  -d '{
    "url": "https://example.com",
    "device": "iphone-15-pro-max",
    "network": "4g"
  }'

# Run AI analysis
curl -X POST https://api.emuluxe.com/v1/analyses \
  -H "Authorization: Bearer YOUR_API_KEY" \
  -H "Content-Type: application/json" \
  -d '{
    "simulation_id": "SIMULATION_ID",
    "categories": ["layout", "performance", "accessibility"]
  }'
Troubleshooting
Simulation Not Loading
Problem: Simulation fails to load or shows blank screen
Solutions:
- Verify the URL is accessible and valid
- Check if the site blocks iframe embedding
- Try a different device profile
- Check your internet connection
- Clear browser cache and cookies
- Contact support if issues persist
Local Tunnel Not Working
Problem: Local tunnel fails to connect to localhost
Solutions:
- Ensure your local server is running
- Check CORS settings allow the tunnel domain
- Verify your firewall allows tunnel connections
- Try a different port for your local server
- Check the platform's tunnel status page
AI Analysis Fails
Problem: AI analysis doesn't complete or shows errors
Solutions:
- Verify you have remaining analysis quota
- Check your internet connection (AI requires cloud processing)
- Try analyzing a simpler page
- Check if the page has blocking scripts
- Contact support if issues persist
Session Sharing Issues
Problem: Team members cannot access shared sessions
Solutions:
- Verify the recipient has an Emuluxe account
- Check if the sharing link has expired
- Ensure team member has appropriate permissions
- Re-generate the sharing link
- For Enterprise, verify SSO configuration
Performance Issues
Problem: Platform is slow or unresponsive
Solutions:
- Close unused parallel simulations
- Reduce the number of devices in parallel mode
- Check your internet connection speed
- Clear browser cache
- Try a different browser
- Contact support if issues persist
Best Practices
Simulation Workflow
- Start Simple: Begin with single device simulation before parallel mode
- Test Critical Paths: Focus on important user flows
- Use Realistic Conditions: Test with appropriate network profiles
- Document Issues: Save sessions with descriptive names and tags
- Iterate Quickly: Use hot-reload for rapid development cycles
Team Collaboration
- Standardize Devices: Agree on a standard device set for team testing
- Share Sessions: Use session sharing for collaborative debugging
- Use Tags: Organize sessions with consistent tagging
- Review Analytics: Regularly review team usage patterns
- Train Team Members: Ensure everyone knows Platform features
Security and Compliance
- Secure API Keys: Never commit API keys to version control
- Use SSO: Enable SSO for enterprise security
- Audit Logs: Regularly review audit logs for suspicious activity
- Data Privacy: Be mindful of what URLs you simulate
- Session Cleanup: Regularly clean up old sessions
Next Steps
After completing the setup:
- Explore IDE Extensions for development workflow integration
- Configure MCP Server for AI agent integration
- Set up CLI Toolchain for automation
- Learn about Command Palette for quick access
- Explore AI Copilot for AI-powered assistance
For additional help, visit the Help Center or contact support@emuluxe.com.