Chrome Extension Setup Guide
This comprehensive guide walks you through the complete process of installing, configuring, and using the Emuluxe Chrome Extension. The extension is the lightweight, instant-access entry point for browser-level simulation, transforming any website into a high-fidelity mobile environment with a single click.
Prerequisites
Before beginning the installation process, ensure you have:
- Chrome Browser: Version 110 or higher (released March 2023 or later)
- Active Internet Connection: Required for authentication and AI features
- Emuluxe Account: Sign up at app.emuluxe.com
- Chrome Web Store Access: Ability to install extensions from the Chrome Web Store
Installation Overview
The installation process follows these key stages:
- Extension Installation - Download and install from Chrome Web Store
- Account Authentication - Link the extension to your Emuluxe account
- License Activation - Activate your subscription tier
- First Simulation - Launch your first mobile simulation
- Feature Configuration - Customize settings for your workflow
Detailed Installation Steps
Step 1: Install from Chrome Web Store
- Navigate to the Emuluxe Chrome Extension page
- Click the "Add to Chrome" button in the top-right corner
- Chrome will display a confirmation dialog showing the permissions the extension requires:
- Read and change your data on all websites: Required for injecting simulation scripts
- Display notifications: For AI analysis alerts and license reminders
- Review the permissions and click "Add extension" to confirm
- Wait for the installation to complete (typically 2-5 seconds)
- The Emuluxe icon will appear in your Chrome toolbar (top-right corner)
Step 2: Pin the Extension to Toolbar
For quick access, pin the extension to your toolbar:
- Click the puzzle piece icon (Extensions) in your Chrome toolbar
- Locate Emuluxe in the list of installed extensions
- Click the pin icon next to Emuluxe
- The Emuluxe icon now appears permanently in your toolbar
- You can drag the icon to reposition it within the toolbar
Step 3: Open the Extension Popup
- Click the Emuluxe icon in your Chrome toolbar
- The extension popup opens, displaying:
- Device Selector: A dropdown or grid of available devices
- Quick Actions: Buttons for common simulation controls
- Account Status: Your current authentication and license status
- Feature Toggles: Quick access to system appearance and other settings
Step 4: Account Authentication
Method A: Automatic Authentication (Recommended)
- If you're already logged into app.emuluxe.com in the same browser profile, the extension will automatically detect your session
- The popup will display your account email and subscription tier
- No additional authentication steps are required
Method B: Manual Authentication
- In the extension popup, click the "Login" or "Connect Account" button
- A new tab opens and redirects to the Emuluxe authentication page
- Enter your email address and password
- Click "Sign In" to authenticate
- Upon successful login, the tab closes automatically
- The extension popup refreshes to show your authenticated status
Step 5: License Activation
If you have a Pro or Enterprise license key:
- In the extension popup, click the "Activate License" button
- Enter your license key in the provided field
- Click "Activate" to validate the key
- The extension contacts the Emuluxe license server to verify the key
- Upon successful activation, your features are unlocked based on your tier:
- Free: 6 devices, 3 AI analyses/day
- Pro: 30+ devices, unlimited AI, sessions
- Enterprise: All Pro features plus team sharing, SSO, audit logs
Step 6: Launch Your First Simulation
- Navigate to any website you want to test (e.g., your localhost development server or a production site)
- Click the Emuluxe icon in your toolbar
- In the device selector, choose your first device (default: iPhone 15 Pro Max)
- Click "Start Simulation" or simply select the device
- The extension immediately transforms the current tab into a mobile simulation
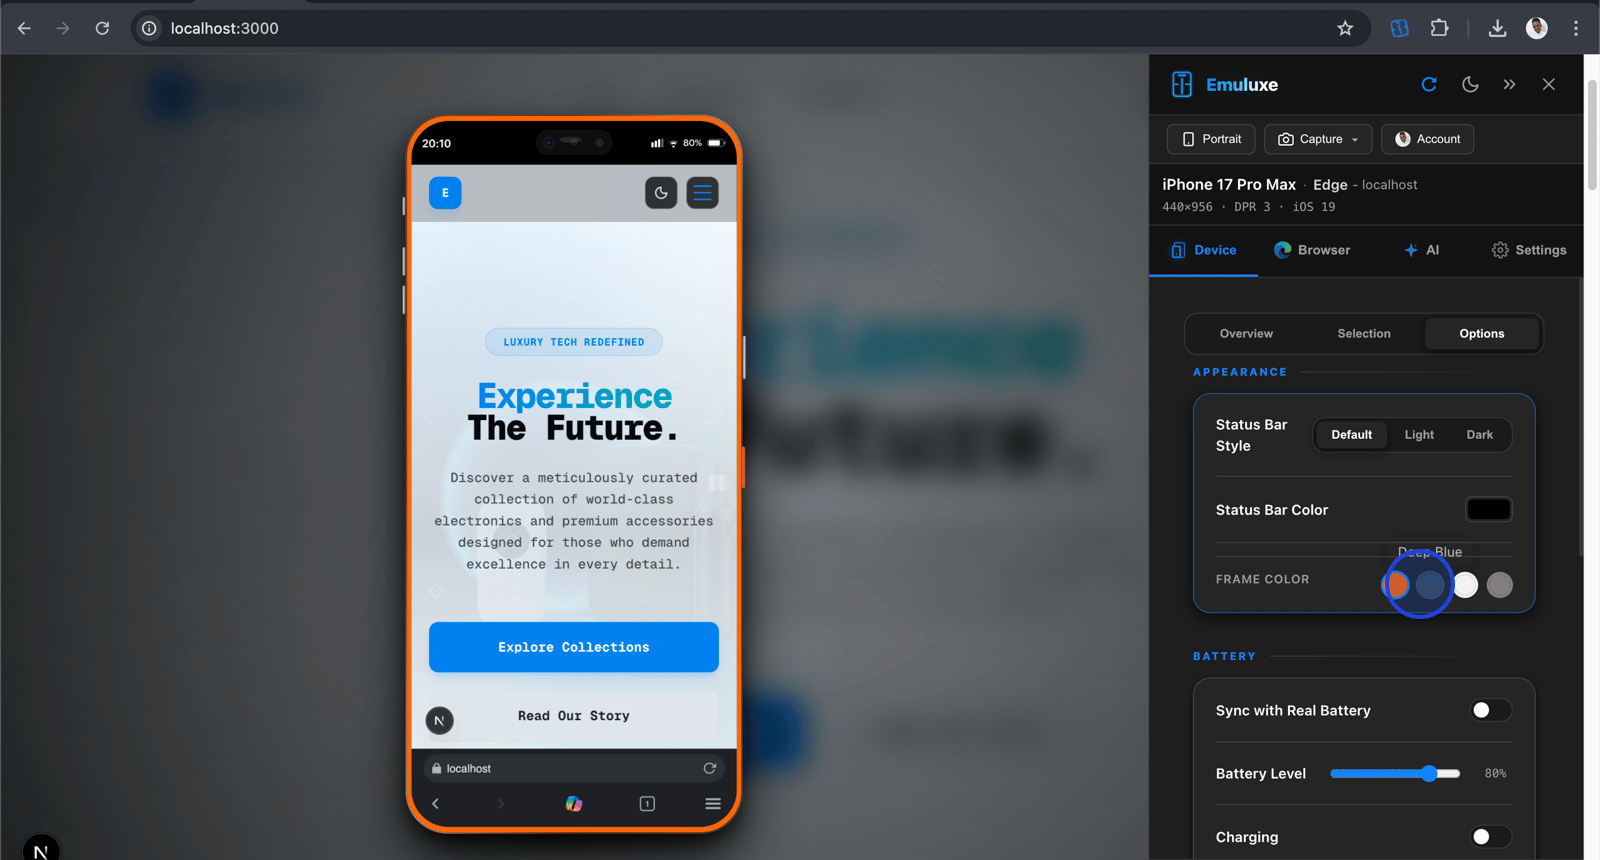
Step 7: Understanding the Simulation Interface
Once simulation is active, you'll see:
- Device Frame: A realistic device bezel with notch/dynamic island
- Viewport: The actual website content rendered at mobile dimensions
- Control Panel: A floating or fixed panel with simulation controls
- Status Indicators: Current device, orientation, and network status
- Safe Area Overlays: Visual indicators for safe area insets
Step 8: Device Selection and Switching
The extension provides access to 30+ device profiles organized by category:
iPhone Series
- iPhone SE: Compact budget iPhone (375x667px, 2x DPR)
- iPhone 14: Standard iPhone (393x852px, 3x DPR)
- iPhone 15: Latest standard iPhone (393x852px, 3x DPR)
- iPhone 15 Pro: Premium iPhone with Dynamic Island (393x852px, 3x DPR)
- iPhone 15 Pro Max: Large premium iPhone (430x932px, 3x DPR)
iPad Series
- iPad mini 6: Compact tablet (744x1133px, 2x DPR)
- iPad Air: Mid-range tablet (820x1180px, 2x DPR)
- iPad Pro 12.9: Large professional tablet (1024x1366px, 2x DPR)
Android Flagships
- Pixel 8 Pro: Google's flagship (412x892px, 3x DPR)
- Galaxy S24 Ultra: Samsung's flagship (412x915px, 3x DPR)
- OnePlus 12: Performance-focused (389x879px, 3x DPR)
Android Mid-Range
- Galaxy A54: Samsung mid-range (360x800px, 2x DPR)
- Pixel 7a: Google mid-range (393x852px, 2x DPR)
Android Budget
- Redmi Note 13: Xiaomi budget (393x851px, 1.75x DPR)
- Moto G Power: Motorola budget (360x760px, 1.5x DPR)
Foldables
- Galaxy Z Fold 6: Samsung foldable with hinge simulation
- Pixel Fold: Google foldable with crease simulation
Desktop Profiles
- MacBook Pro: Apple laptop simulation
- Windows Laptop: Windows laptop simulation
- 4K Display: High-resolution desktop monitor
Step 9: System Appearance Toggle
Toggle between Light and Dark system appearance:
- In the control panel, locate the Appearance toggle
- Click to switch between Light and Dark mode
- The extension updates the
prefers-color-schememedia query - Your website's dark mode styles (if implemented) activate immediately
- Test both modes to ensure your design works in all conditions
Step 10: Orientation Switching
Switch between portrait and landscape orientations:
- In the control panel, click the Orientation toggle or icon
- The device frame rotates 90 degrees
- The viewport dimensions swap (e.g., 393x852 becomes 852x393)
- The website reflows according to its responsive design
- Test critical user flows in both orientations
Step 11: Hardware Feature Simulation
Safe Area Insets
The extension renders accurate safe area insets:
- Notch/Dynamic Island: Top inset for iPhone X and later
- Home Indicator: Bottom inset for devices without physical home buttons
- CSS Environment Variables: The extension sets
env(safe-area-inset-top),env(safe-area-inset-bottom),env(safe-area-inset-left), andenv(safe-area-inset-right) - Visual Overlays: Colored overlays show safe area boundaries for debugging
Device Frames and Bezels
- Realistic Bezels: Device frames match actual hardware dimensions
- Notch Simulation: Accurate notch placement for iPhone X and later
- Dynamic Island: Animated Dynamic Island for iPhone 14 Pro and later
- Home Indicator: Software home bar gesture area for edge-to-screen devices
Touch Simulation
The extension simulates touch interactions:
- Touch Pointer: Your mouse cursor acts as a touch point
- Hover States: Hover effects are suppressed to simulate touch-first behavior
- Scroll Momentum: iOS-style scroll momentum and bounce effects
- Gesture Simulation: Basic swipe and pinch gestures (where supported)
Step 12: Network Throttling
Simulate various network conditions:
- In the control panel, click the Network dropdown
- Select from pre-configured profiles:
- Online: No throttling (default)
- 4G: 10 Mbps download, 5 Mbps upload, 100ms latency
- 3G: 1.5 Mbps download, 750 Kbps upload, 200ms latency
- 2G: 250 Kbps download, 50 Kbps upload, 500ms latency
- Offline: No network connectivity
- The extension uses Chrome's DevTools Network Throttling API
- Resource loading times immediately reflect the selected condition
- Test your site's performance under poor network conditions
Step 13: AI-Powered Analysis
The built-in AI engine runs comprehensive diagnostics:
Triggering AI Analysis
- In the control panel, click the "Run AI Analysis" button
- The AI analyzer scans your current page
- Analysis typically completes in 5-15 seconds depending on page complexity
- Results appear in a dedicated panel or sidebar
Analysis Categories
Layout Shift Detection
- Identifies Cumulative Layout Shift (CLS) issues
- Detects elements that cause unexpected layout changes
- Provides specific selectors and code snippets for fixes
Performance Analysis
- Measures Largest Contentful Paint (LCP)
- Identifies long tasks blocking the main thread
- Suggests performance optimizations
Accessibility Checks
- WCAG 2.1 compliance verification
- Color contrast analysis
- ARIA attribute validation
- Keyboard navigation testing
Interaction Analysis
- Hover-to-touch translation issues
- Touch target size violations
- Scroll container problems
- Gesture anti-patterns
Viewing Results
- Results are categorized by severity (Critical, High, Medium, Low)
- Each issue includes:
- Description: Clear explanation of the problem
- Selector: CSS selector for the affected element
- Code Snippet: Suggested fix with before/after code
- Impact: How this affects user experience
- Click on any issue to highlight the affected element on the page
- Use the provided code snippets to implement fixes
Step 14: Screenshot and Video Capture
Capture high-fidelity screenshots and recordings:
Screenshot Capture
- In the control panel, click the Camera icon
- A screenshot is captured including:
- The device frame and bezels
- The rendered website content
- Current orientation and device state
- Safe area overlays (if enabled)
- The screenshot downloads to your default downloads folder
- File naming includes timestamp and device information
Video Recording
- In the control panel, click the Record button
- Perform the actions you want to document
- Click Stop Recording when finished
- The video downloads as an MP4 file
- Videos include the device frame and all interactions
Step 15: Session Management (Pro/Enterprise)
Save and share simulation states:
Saving a Session
- Configure your desired device, orientation, network, and appearance settings
- Navigate to the specific URL and scroll position you want to preserve
- In the control panel, click "Save Session"
- Enter a name for the session (e.g., "Checkout Flow - iPhone 15 Pro")
- The session is saved to your Emuluxe account cloud storage
Loading a Session
- In the extension popup, click "Sessions"
- Select a saved session from the list
- The extension restores:
- Device configuration
- Orientation and appearance settings
- Network conditions
- URL and scroll position
- Cookie and local storage state
Sharing Sessions
- In the Sessions list, click the Share button next to a session
- Generate a shareable link or invite team members via email
- Recipients can load the exact simulation state you created
- Perfect for collaborative debugging and QA
Step 16: Advanced Configuration
Custom Device Profiles
Create custom device configurations:
- In the extension popup, click "Settings" or the gear icon
- Navigate to the Devices section
- Click "Add Custom Device"
- Specify:
- Device Name: Display name for the profile
- Width: Viewport width in pixels
- Height: Viewport height in pixels
- Device Pixel Ratio: Screen density (typically 2x or 3x)
- User Agent: Custom user agent string (optional)
- Save the profile for quick access
Keyboard Shortcuts
Configure custom keyboard shortcuts:
- In Chrome, navigate to
chrome://extensions/shortcuts - Locate Emuluxe in the extensions list
- Customize shortcuts for:
- Toggle Simulation: Open/close simulation
- Change Device: Open device selector
- Rotate Device: Toggle orientation
- Take Screenshot: Capture current state
- Run AI Analysis: Trigger AI diagnostics
Command Palette
Access quick commands:
- Press
Ctrl+K(Windows/Linux) orCmd+K(Mac) within any tab - The Emuluxe command palette appears
- Type to search for commands:
- "iPhone" to quickly select iPhone devices
- "Dark" to toggle dark mode
- "Screenshot" to capture the current state
- "Analyze" to run AI diagnostics
Technical Architecture
How the Extension Works
The Emuluxe Chrome Extension uses a sophisticated multi-layer architecture:
Content Script Injection
- When you activate simulation, the extension injects content scripts into the current page
- Scripts run in both the ISOLATED world (for UI and messaging) and MAIN world (for API spoofing)
- The MAIN world script overrides browser APIs to simulate mobile behavior
API Spoofing
The extension overrides these JavaScript APIs:
- navigator.userAgent: Returns mobile user agent strings
- screen.width/height: Returns mobile screen dimensions
- window.devicePixelRatio: Returns accurate mobile DPR
- navigator.maxTouchPoints: Simulates touch capability
- navigator.hardwareConcurrency: Simulates mobile CPU core count
- navigator.deviceMemory: Simulates mobile RAM (where supported)
CSS Manipulation
The extension applies CSS transformations:
- Viewport Meta Tag: Enforces mobile viewport scaling
- Safe Area Insets: Sets CSS environment variables for safe areas
- Touch Action: Configures touch interaction behavior
- Scroll Behavior: Implements iOS-style scroll physics
Shadow DOM UI
The extension's UI is rendered in a Shadow DOM to:
- Isolate Styles: Prevent conflicts with page stylesheets
- Ensure Visibility: Guarantee UI appears regardless of page CSS
- Maintain Performance: Efficient rendering without page reflows
Manifest V3 Compliance
The extension is fully compliant with Chrome's Manifest V3 requirements:
- No eval(): No dynamic code execution
- Service Worker: Uses stateless service worker instead of persistent background page
- DeclarativeNetRequest: Uses DNR API for network modification instead of webRequest
- CSP Compliance: Strict Content Security Policy on all HTML pages
- Web Accessible Resources: All injected scripts declared in manifest
Troubleshooting
Extension Not Loading
Problem: Extension icon doesn't appear or popup doesn't open
Solutions:
- Verify Chrome version is 110 or higher
- Check if extension is enabled in
chrome://extensions/ - Try disabling other extensions that might conflict
- Restart Chrome and try again
- Check Chrome's extension error logs
Simulation Not Activating
Problem: Clicking device selector doesn't start simulation
Solutions:
- Ensure you're on a valid HTTP/HTTPS page (not chrome:// pages)
- Check that the page allows content script injection
- Try refreshing the page before activating simulation
- Check browser console for error messages
- Verify your account is authenticated
Device Frames Not Displaying
Problem: Simulation works but device frames are missing
Solutions:
- Ensure you have a Pro or Enterprise subscription (frames are a paid feature)
- Check that hardware acceleration is enabled in Chrome settings
- Update your graphics drivers
- Try a different device profile
- Check if the page has CSS that might overlay the frame
AI Analysis Not Working
Problem: AI analysis button is disabled or fails
Solutions:
- Verify you have remaining AI analysis quota (Free: 3/day, Pro/Enterprise: unlimited)
- Check your internet connection (AI requires cloud processing)
- Ensure your account is authenticated
- Try a simpler page to test if the issue is page complexity
- Check if your subscription tier includes AI features
Network Throttling Not Applying
Problem: Selected network profile doesn't affect page loading
Solutions:
- Refresh the page after changing network settings
- Check if DevTools are open (they can override network settings)
- Try closing and reopening the simulation
- Verify the selected profile is actually applied in the control panel
- Check Chrome's network tab to confirm throttling is active
License Activation Fails
Problem: License key is rejected or activation fails
Solutions:
- Verify the license key is entered correctly (no extra spaces)
- Check that the license hasn't expired
- Ensure your license tier matches the features you're trying to use
- Contact support if the key should be valid but isn't working
- Try logging out and back into your Emuluxe account
Best Practices
Development Workflow
- Test Early and Often: Use simulation throughout development, not just at the end
- Test Multiple Devices: Verify across different device categories and screen sizes
- Test Network Conditions: Don't assume fast, reliable connections
- Use AI Analysis: Leverage automated diagnostics to catch issues you might miss
- Document Issues: Use screenshots to document mobile-specific bugs
Performance Optimization
- Close Unused Simulations: Multiple active simulations can impact browser performance
- Use Appropriate Devices: Test with devices relevant to your target audience
- Monitor Browser Resources: Check Chrome's task manager for resource usage
- Cache Analysis Results: Reuse previous analysis results when possible
Testing Strategy
- Critical User Flows: Test your most important user journeys on multiple devices
- Edge Cases: Test unusual screen sizes and orientations
- Network Variability: Test under different network conditions
- Accessibility: Use AI analysis to verify WCAG compliance
- Cross-Browser: Test in Chrome, Safari, and Firefox if applicable
Security and Privacy
- Data Collection: Only anonymous usage analytics and authentication tokens are collected
- Page Content Privacy: Your page content never leaves your browser for basic simulation
- AI Processing: AI analysis sends page structure (not content) to cloud for analysis
- Secure Storage: License keys and tokens stored securely in Chrome storage
- Encrypted Communication: All dashboard communication uses HTTPS
- No Remote Code: The extension does not execute remote code or download external scripts
- Permission Model: Extension only requests necessary permissions for simulation
Integration with Other Emuluxe Products
The Chrome Extension integrates seamlessly with other Emuluxe products:
Emuluxe Platform
- Session Sync: Sessions saved in the extension appear in the Platform dashboard
- Team Sharing: Share extension sessions with team members via the Platform
- Advanced Features: Platform-exclusive features (parallel simulation, fleet audits) complement extension usage
IDE Extensions
- Bi-Directional Sync: Settings sync between Chrome Extension and IDE extensions
- Session Portability: Use sessions created in IDE extensions within the Chrome Extension
- Unified Account: Single authentication across all Emuluxe products
CLI Toolchain
- Profile Sharing: Custom device profiles created in CLI appear in extension
- Automation: CLI can trigger extension-based simulations for automated testing
- Configuration Sync: Network profiles and other settings sync across tools
Next Steps
After completing the setup:
- Explore the Emuluxe Platform for advanced features
- Learn about IDE Extensions for development workflow integration
- Configure Network Throttling for realistic testing
- Set up Session Management for collaborative debugging
- Explore AI Analysis for automated issue detection
For additional help, visit the Help Center or contact support@emuluxe.com.