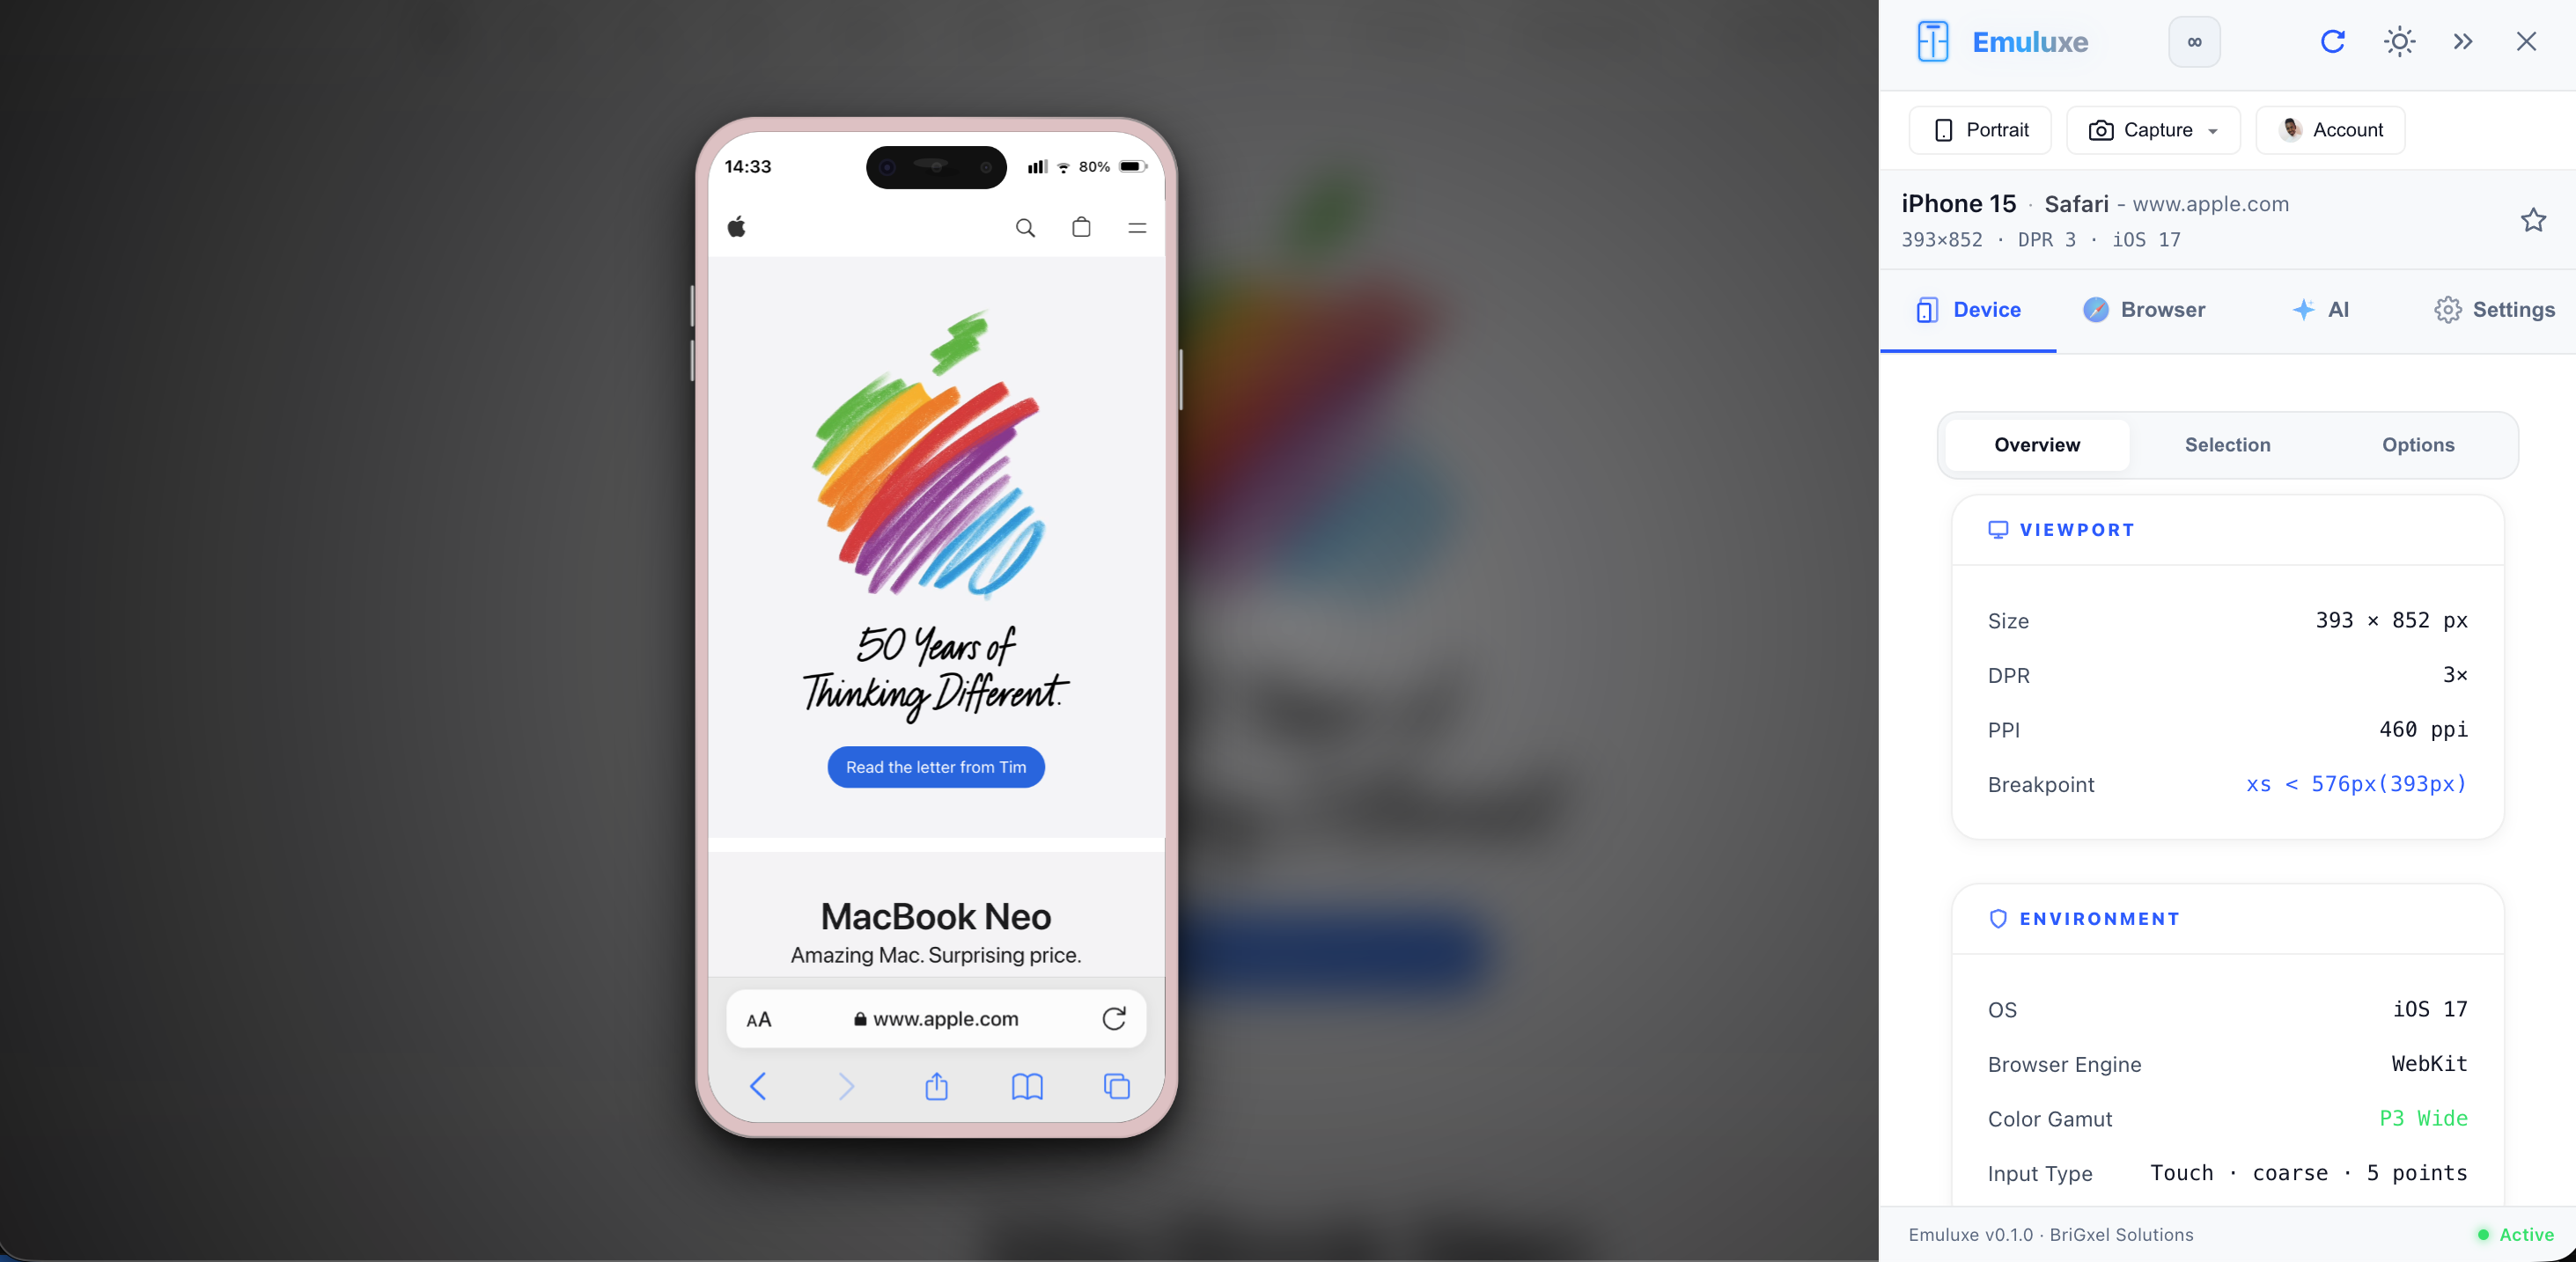
Browser UI Engine
The Emuluxe Browser UI Engine is responsible for rendering the realistic "Chrome" (address bars, toolbars, and navigation controls) that surrounds your web applications during simulation. This ensures that your audits account for the physical screen real estate consumed by the mobile browser itself.
Browser Extensions & Controls
You can customize the visibility and behavior of the simulated browser UI in the Browser Settings:
Navigation Bars
- Show Top Bar: Toggles the visibility of the status bar and top-aligned address bars (found in Android Chrome and iOS Landscape Safari).
- Show Bottom Bar: Toggles the primary navigation toolbar (Safari iOS Portrait).
- Show Full URL: When enabled, the address bar displays the entire URI (e.g.,
https:/emuluxe.com/simulation) instead of just the hostname.
Platform Physics
- Native Scrollbars: Toggles between the host OS scrollbars and the simulated, platform-specific scroll physics (Inertial Scrolling).
Environment Backdrop
To provide a focused auditing environment, Emuluxe allows you to customize the Backdrop Mode behind the simulated device:
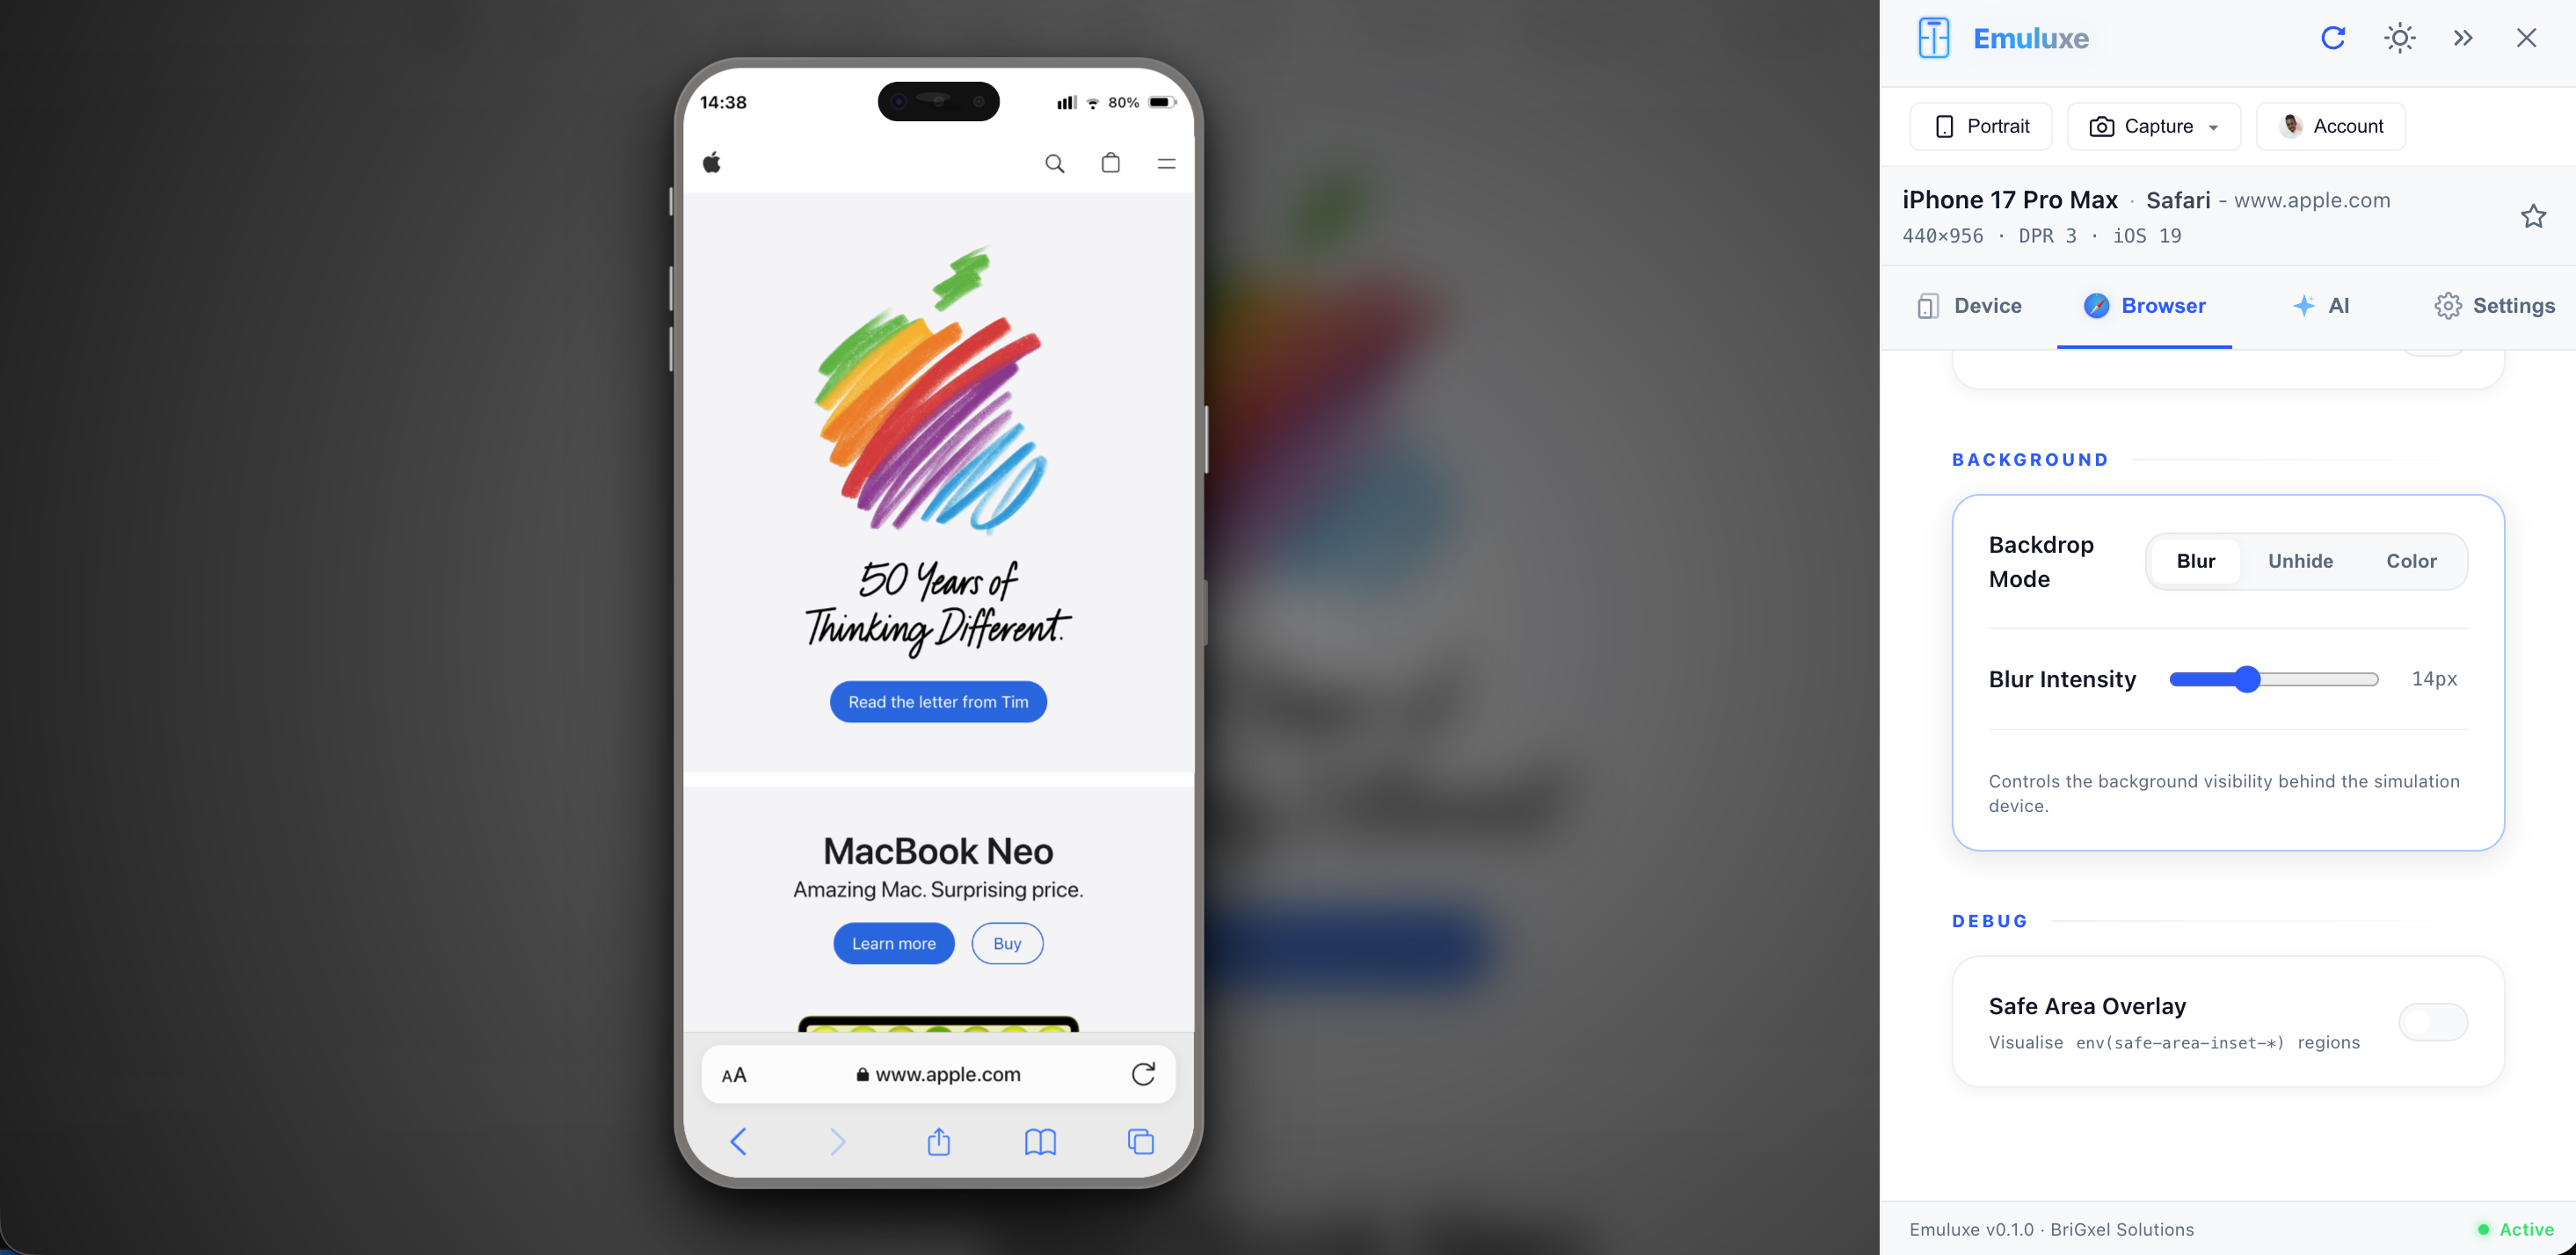
Blur Mode
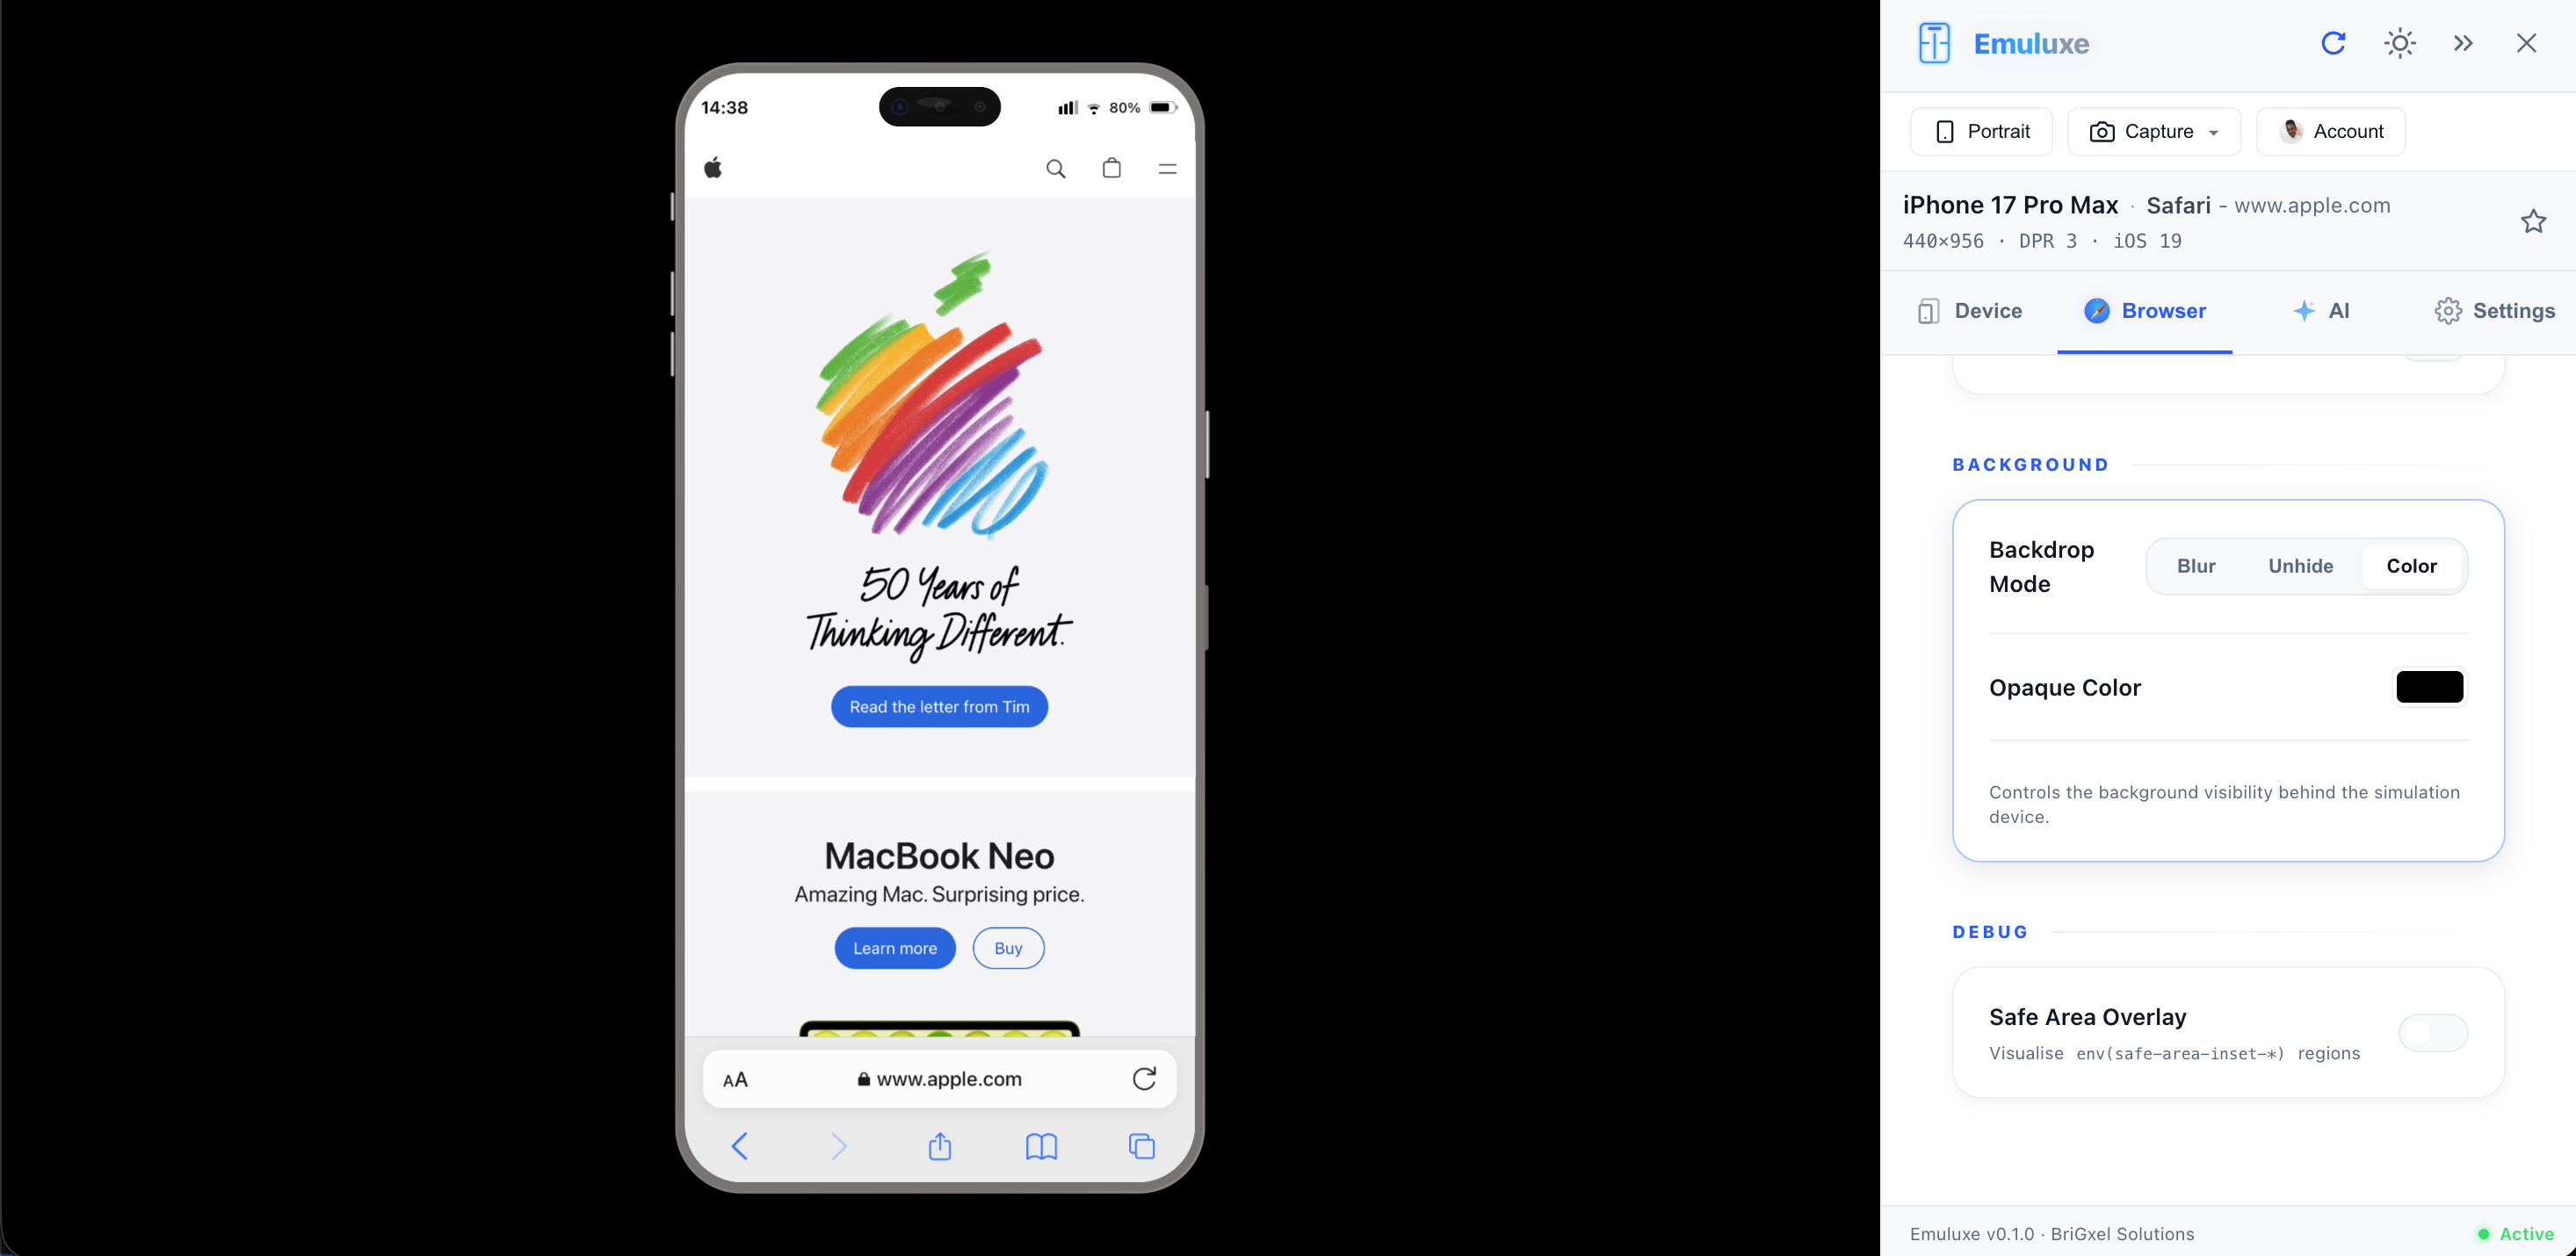
Color Mode
- Blur Intensity: Adjust the backdrop blur from 0px to 40px (Default: 14px). This helps control visual noise during deep audits.
Debugging Tools
Safe Area Overlay
The Safe Area Overlay is a critical debug tool that visualizes the env(safe-area-inset-*) regions in real-time.
- Visualisation: Highlighting the restricted areas (Notches, Home Bars) in a semi-transparent red or green overlay.
- Audit Mode: Quickly verify if your content is "overflowing" into hardware dead-zones without guesswork.
[!TIP] Use the Command Palette (⌘ + K) and type "Toggle Browser UI" to quickly hide all chrome for an edge-to-edge view.
Next, explore the specifics of iOS Browsers.