Emuluxe AI Analysis
The Emuluxe AI Engine automates root-cause analysis and visual auditing across all your simulated devices. By leveraging the Emuluxe Chrome Extension or the Platform Simulator, the AI can inspect the actual rendered DOM and CSS to identify cross-device issues instantly.
[!NOTE] AI Analysis is available exclusively to Pro and Enterprise users.
How it Works
The AI Engine extracts the current DOM and CSS payload from each active device in your simulation cluster. This data, alongside viewport and user-agent context, is sent securely to our analysis pipeline where it is evaluated against modern web standards and heuristics.
Analysis Categories
The AI provides holistic feedback across five core categories:
- Style: Checks colors, typography consistency, and contrast ratios.
- Layout: Inspects spacing, responsive bounds, and hidden overflow issues.
- Interaction: Evaluates touch target sizes, tap highlights, and overall gesture ergonomics on mobile screens.
- Accessibility: Audits ARIA roles, semantic HTML, and WCAG compliance.
- Performance: Estimates rendering cost and DOM payload size.
Using the Extension AI Panel
When using the Emuluxe Chrome Extension, open the DevTools-style panel and navigate to the AI Analyzer tab.
- Select your target analysis category.
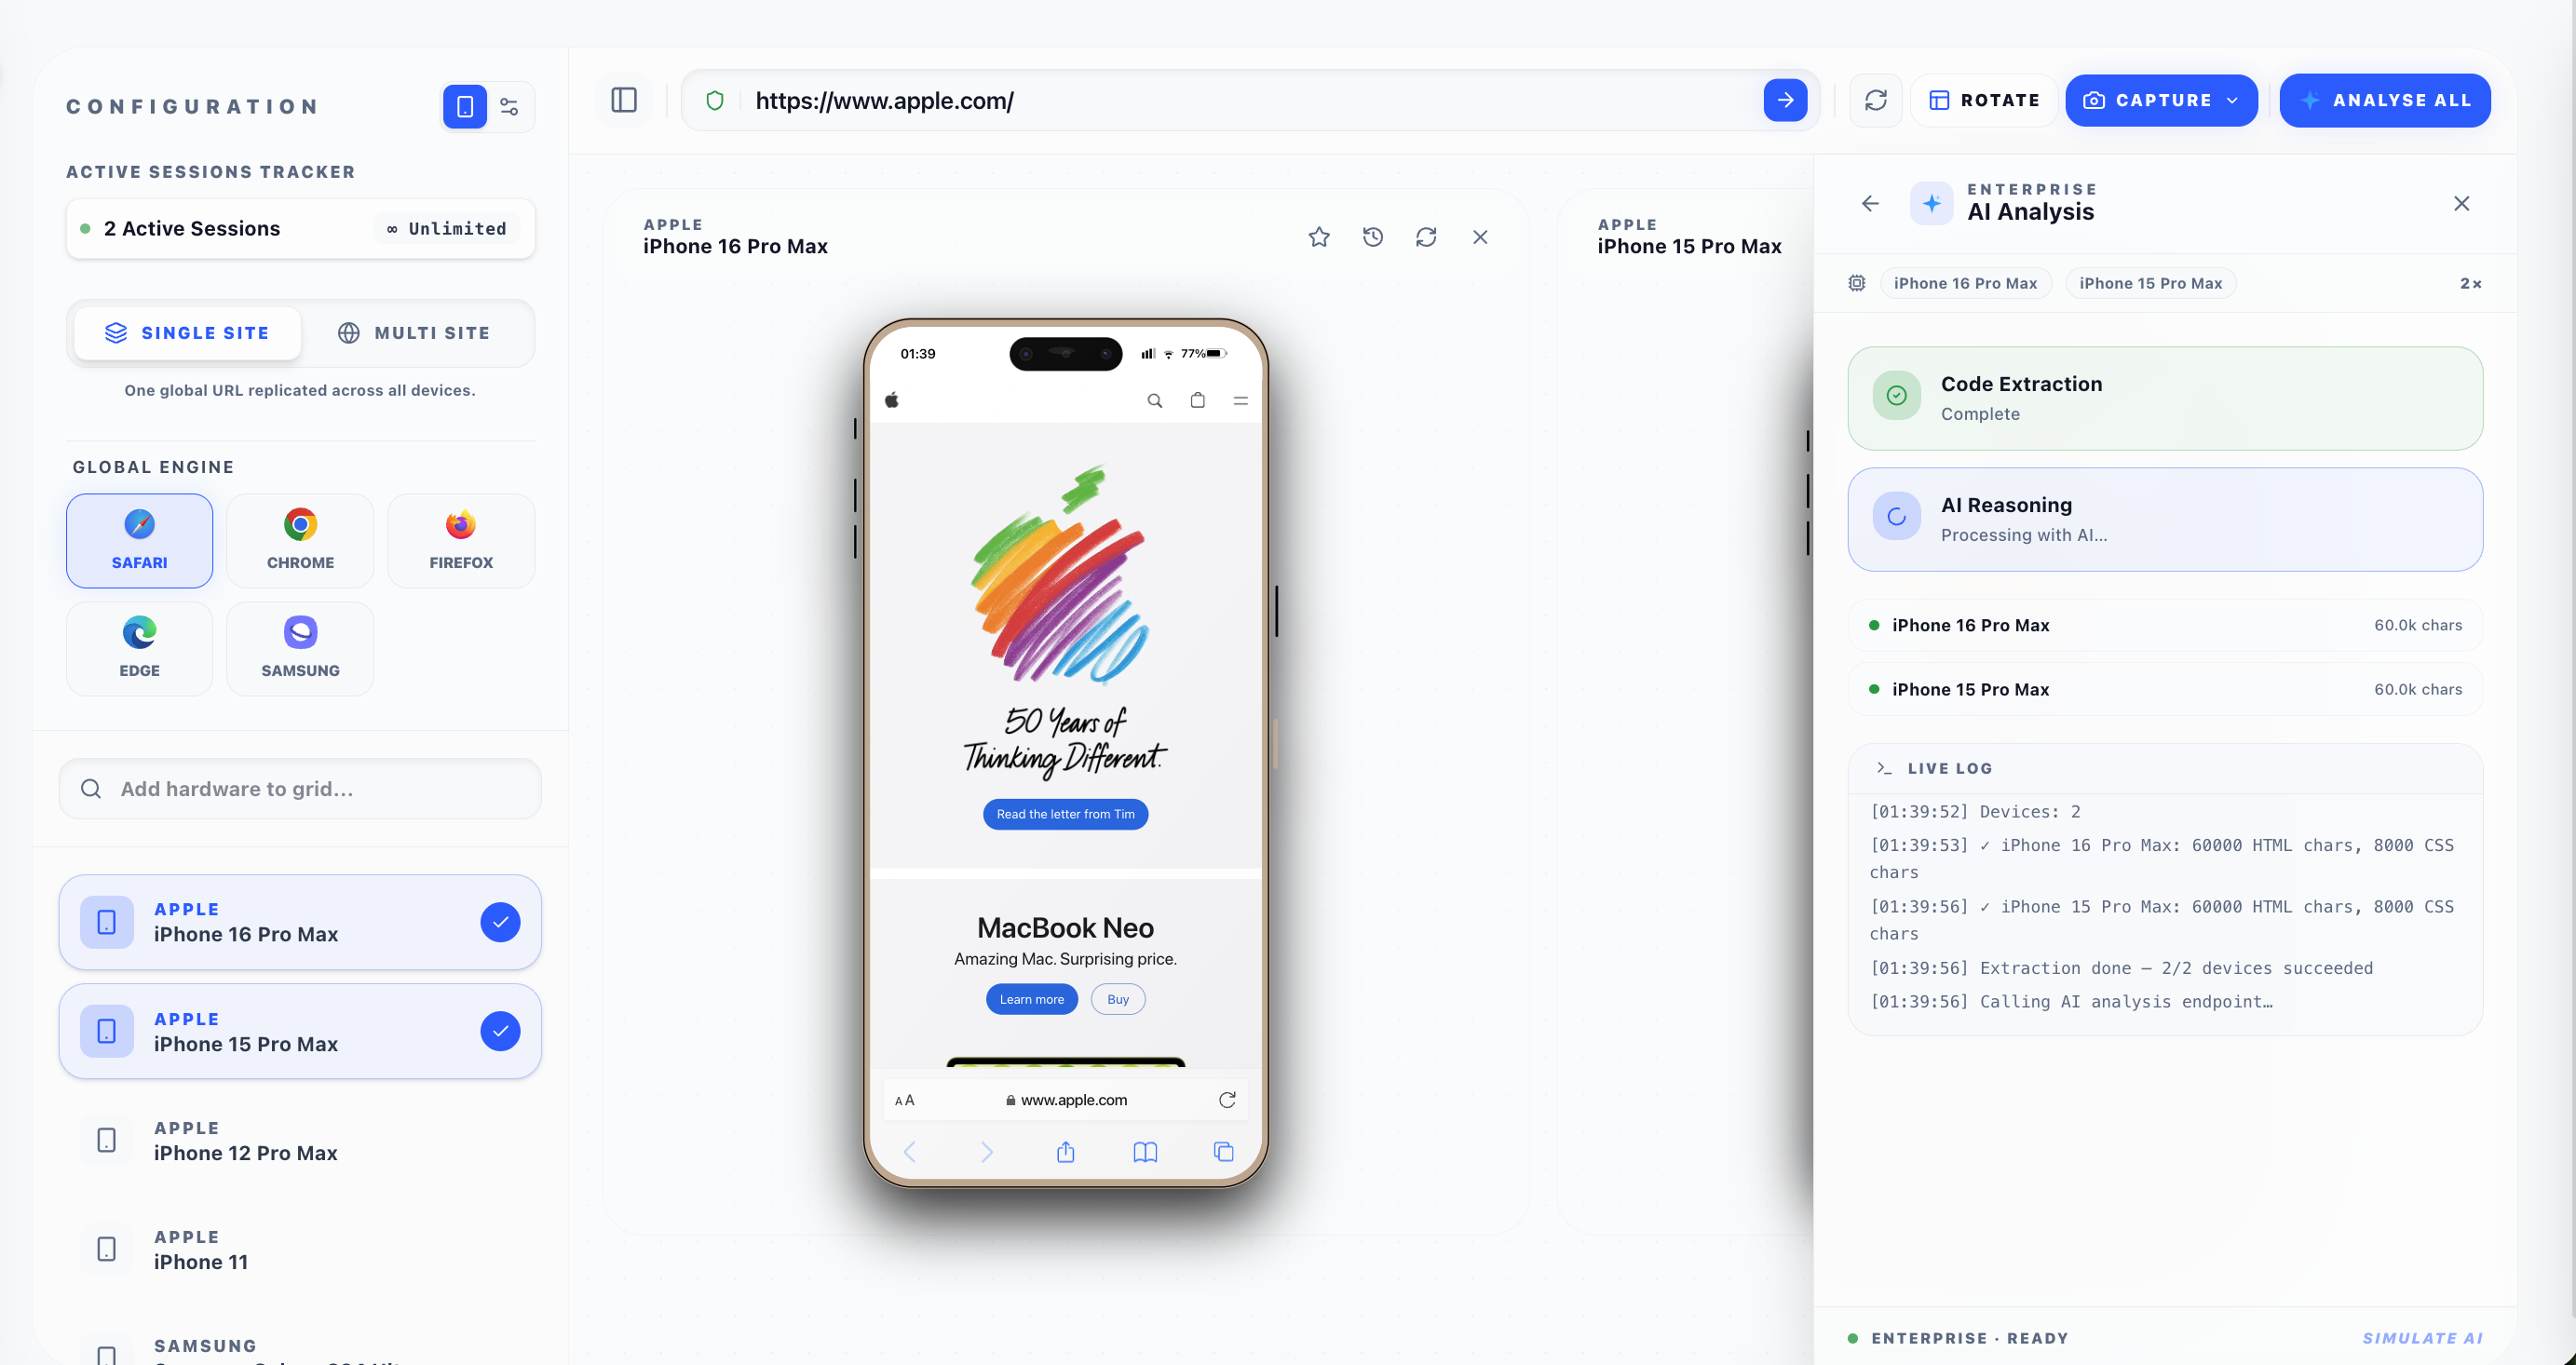
- Click Analyze to begin extraction.
- The panel will display progress as it extracts code from the page and communicates with the AI Engine.
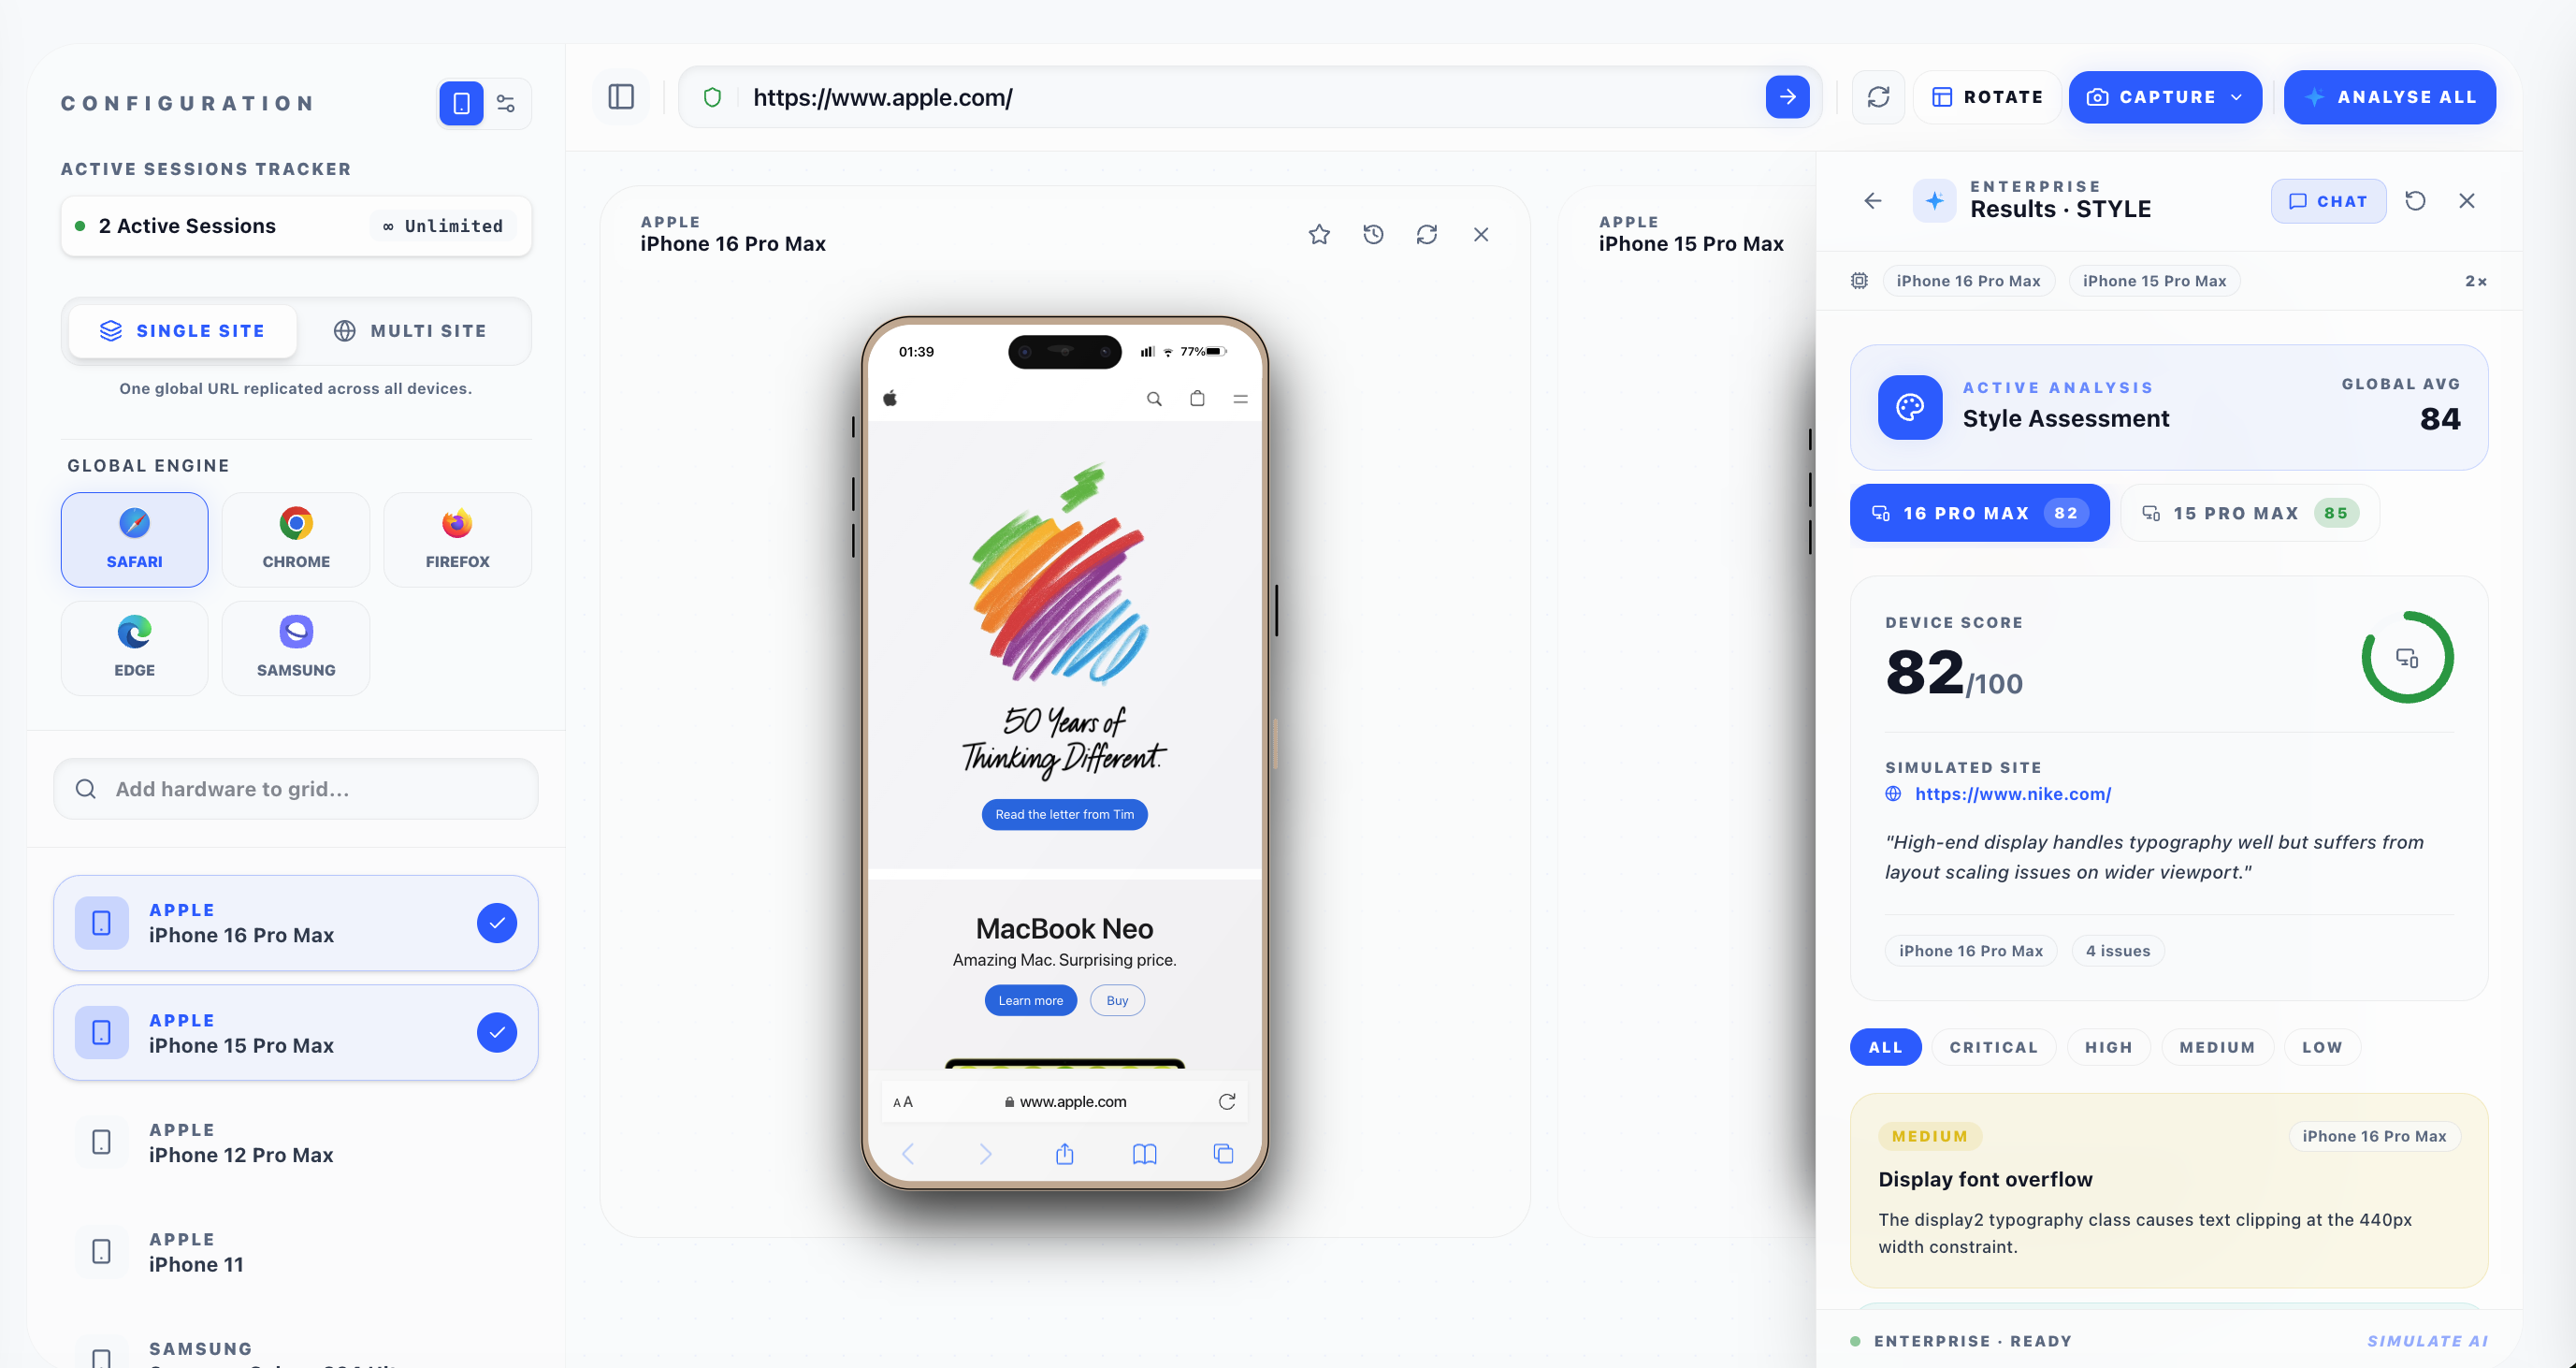
- Once complete, you'll receive a detailed breakdown of issues aggregated by severity (Critical, High, Medium, Low) for each simulated device.
Using the Platform Simulator
In the web platform's Simulate Dashboard, the AI drawer is accessible via the glowing Simulate AI tab on the right side of the screen.
- Open the AI drawer to view the active devices running in your fleet.
- Choose a category like Layout or Interaction.
- The platform will automatically extract iframe content and run the analysis.
- Switch between device tabs in the results view to see exact, device-specific recommendations.