IDE Extensions Setup Guide
This comprehensive guide walks you through the complete process of installing, configuring, and using the Emuluxe IDE extensions across VS Code, Cursor, Claude, Windsurf, and Antigravity. The Emuluxe IDE extension brings the hardware foundry directly into your coding environment, eliminating context switching by providing real-time, high-fidelity mobile preview alongside your source code.
Prerequisites
Before beginning the installation process, ensure you have:
- Active Internet Connection: Required for authentication and dashboard sync
- Emuluxe Account: Sign up at app.emuluxe.com
- IDE Requirements:
- VS Code: Version 1.80.0 or higher
- Cursor: Latest version with MCP support
- Claude Desktop & Claude Code: Latest version with MCP support
- Windsurf: Latest version with Cascade MCP support
- Codex AI: Latest version with MCP support
- Antigravity: Latest version with MCP support
- Development Server: A running local server (Vite, Webpack, Live Server, etc.) for testing
Installation Overview
The installation process follows these key stages:
- Extension Installation - Download and install the extension in your preferred IDE
- Authentication - Link your IDE to your Emuluxe account
- Configuration - Set up your API token and preferences
- Smart Discovery - Configure local server detection
- First Simulation - Launch your first mobile simulation
Detailed Installation Steps
Step 1: Install the Extension
For VS Code Users
- Open VS Code and navigate to the Extensions view by pressing
Cmd+Shift+Xon macOS orCtrl+Shift+Xon Windows/Linux - In the search bar, type "Emuluxe" to find the extension
- Click the Install button on the Emuluxe extension card
- Wait for the installation to complete (typically 5-10 seconds)
- Alternatively, install directly from the VS Code Marketplace
For Cursor Users
- Open Cursor and access the Extensions view through the sidebar or via keyboard shortcut
- Search for "Emuluxe" in the extension marketplace
- Click Install to add the extension to your Cursor environment
- The extension will automatically integrate with Cursor's AI-native architecture
- View the listing on the Cursor Directory for additional details
For Antigravity Users
- Open Antigravity and navigate to the Extensions section
- Search for "Emuluxe" in the extension registry
- Click Install to enable the integration
- The extension provides Antigravity agents with direct access to hardware fingerprints
- Alternatively, install from the Open VSX Registry
For Claude Desktop & Claude Code Users
- Open Claude Desktop Settings or your terminal for Claude Code.
- For Desktop: Click the MCP Servers button (hammer icon) and configure
claude_desktop_config.json. - For Code: Use the
claude mcp addcommand from your platform dashboard. - The MCP server provides plan-aware routing for mobile simulation.
For Codex AI Users
- Open Codex and navigate to MCP Settings.
- Select "Connect to a custom MCP" or use the CLI command from your dashboard.
- Once configured, Codex agents can launch high-fidelity simulations directly in the IDE.
For Windsurf Users
- Open Windsurf Settings
- Click the MCP Servers button (hammer icon) in the bottom bar or chat panel.
- Select Configure or View raw config to open
mcp_config.json. - Copy the Emuluxe MCP server block from your dashboard Integrations page.
- Save the file and click Refresh in the MCP settings.
- The extension uses the VS Code extension for native in-IDE simulation.
Step 2: Authentication Setup
Method A: Manual Login via Command Palette
- Open the Command Palette in your IDE:
- VS Code/Cursor/Claude/Windsurf/Antigravity:
Cmd+Shift+P(macOS) orCtrl+Shift+P(Windows/Linux)
- VS Code/Cursor/Claude/Windsurf/Antigravity:
- Type "Emuluxe: Login" and select the command
- Your default browser will open and navigate to the Emuluxe authentication page
- Log in with your Emuluxe account credentials
- Upon successful authentication, you'll receive an API token
- Copy this token for the next configuration step
Method B: One-Click Sync (Recommended)
- Navigate to your Integrations Settings in the Emuluxe dashboard.
- Locate the section for your IDE (VS Code, Cursor, Windsurf, Codex, or Antigravity).
- Click the Sync / Login (Extension) or Connect (MCP) button corresponding to your tool.
- Note: Claude and Codex use the Connect/Sync flow tailored to their specific configuration files.
- For MCP: Click "Add MCP Server" to get the automated installer (Cursor) or manual command (VS Code).
- This method is faster and reduces the risk of token entry errors.
Step 3: Token Configuration (Manual Method Only)
If you used Method A for authentication, complete these steps:
- Open your IDE Settings:
- VS Code/Cursor/Claude/Windsurf/Antigravity:
Cmd+,(macOS) orCtrl+,(Windows/Linux)
- VS Code/Cursor/Claude/Windsurf/Antigravity:
- In the search bar, type "Emuluxe" to filter settings
- Locate the "Emuluxe: Token" field
- Paste your API token (copied from Step 2)
- The token is stored securely in your IDE's credential storage
- Tokens expire after 30 days; you'll be prompted to re-login when needed
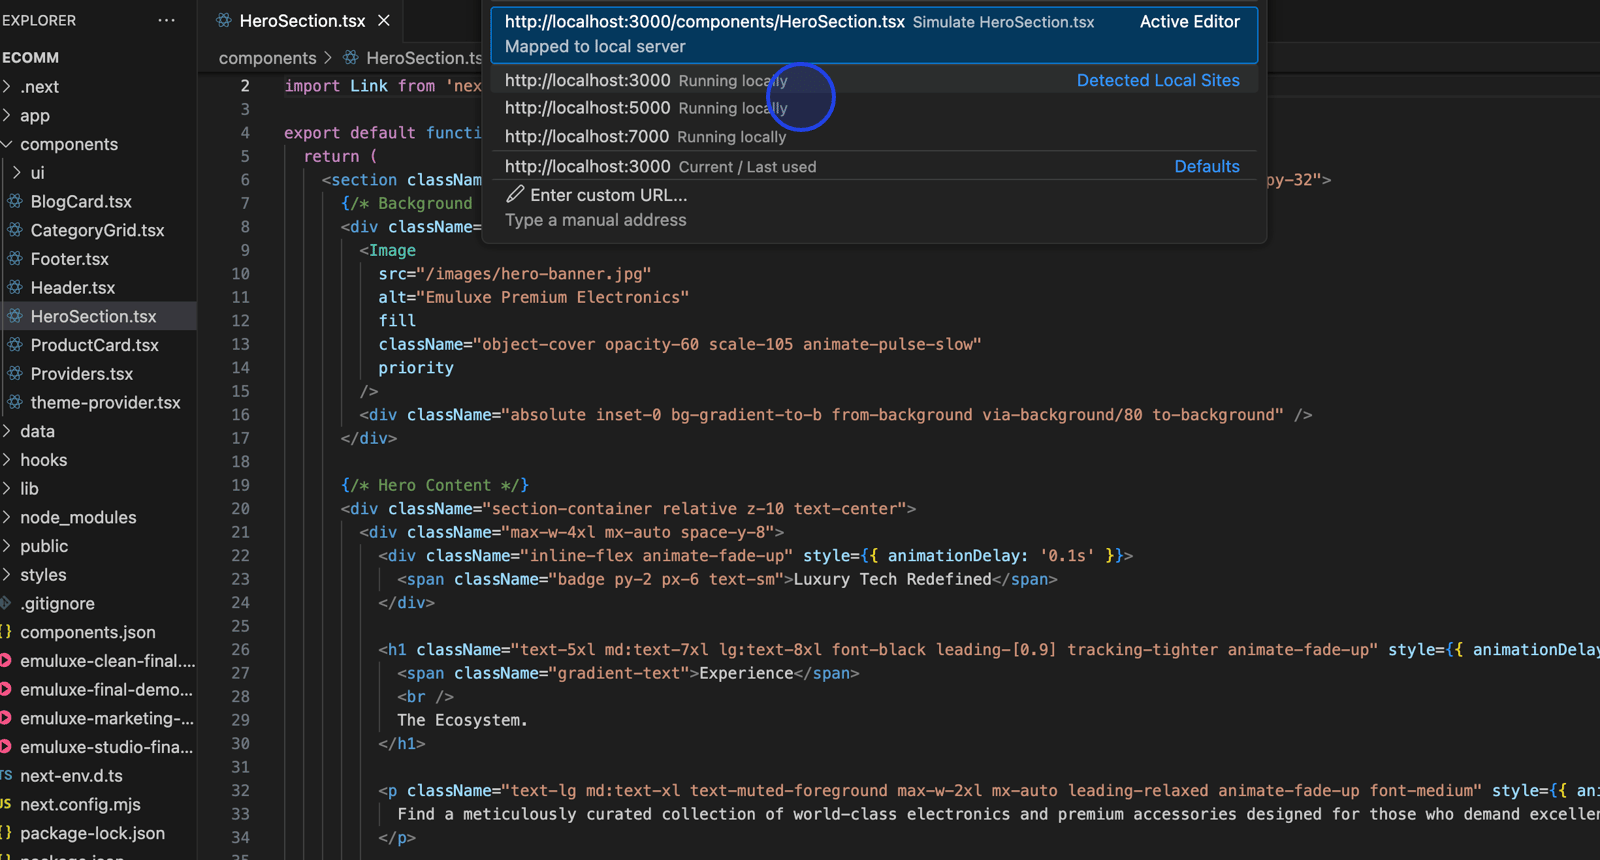
Step 4: Smart Localhost Discovery
The Emuluxe extension automatically detects running development servers:
- Ensure your development server is running (e.g.,
npm run dev,vite,webpack serve) - The extension scans common ports (3000, 3001, 4000, 5000, 5173, 8080, etc.)
- Detected servers appear in the quick-pick interface when you launch simulation
- The discovery process runs in the background without interrupting your workflow
- If your server uses a non-standard port, you can manually enter the URL
Step 5: Launch Your First Simulation
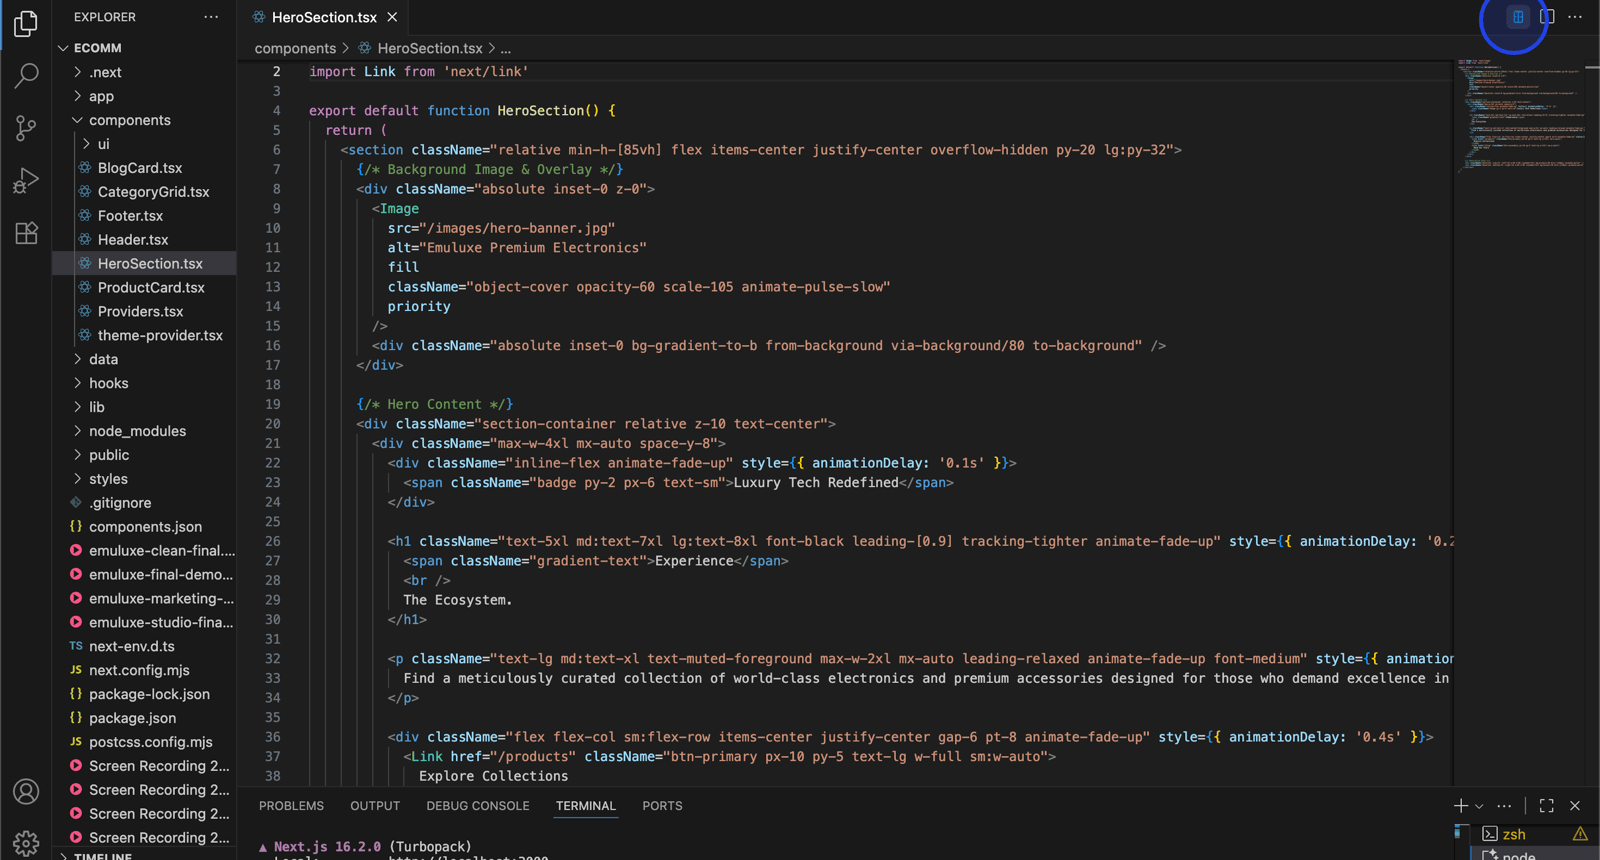
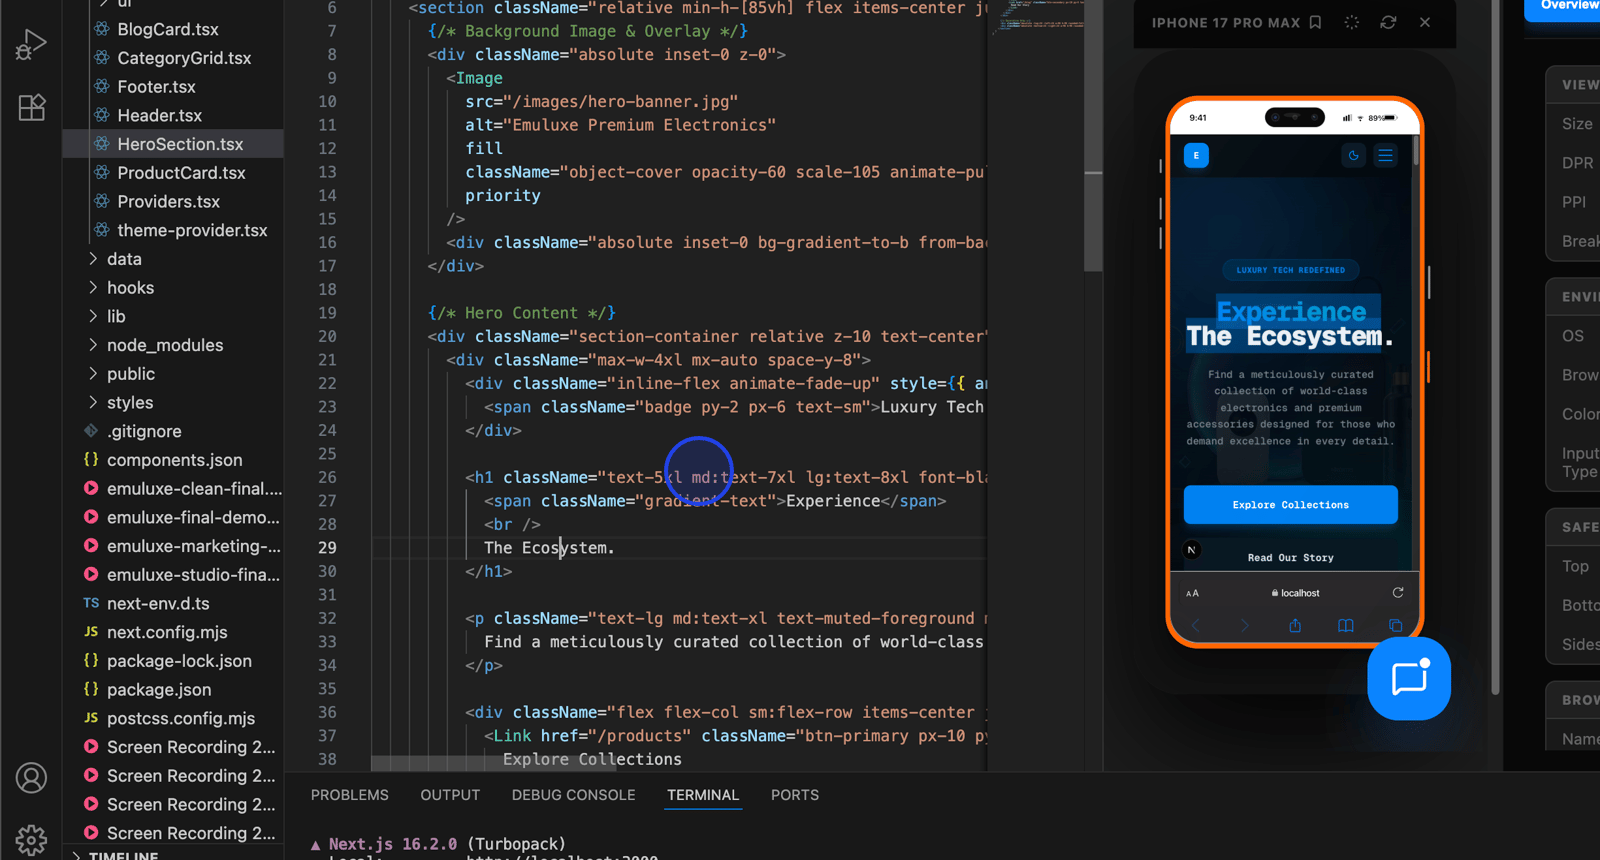
Using the Toolbar Logo
- Click the Emuluxe logo in the top-right corner of any editor tab
- The Smart Discovery interface opens, showing detected local servers
- Select your desired server from the list
- The simulation panel opens with the default device (iPhone 15 Pro Max)
Using Keyboard Shortcuts
- Press
Cmd+Alt+E(macOS) orCtrl+Alt+E(Windows/Linux) - The quick-pick interface appears with server options
- Select your target server
- Simulation launches immediately in a dedicated panel
Using Context Menu
- Right-click on any file, folder, or editor tab
- Select "Emuluxe: Start Simulation" from the context menu
- The extension infers the appropriate URL based on your project structure
- Simulation begins automatically
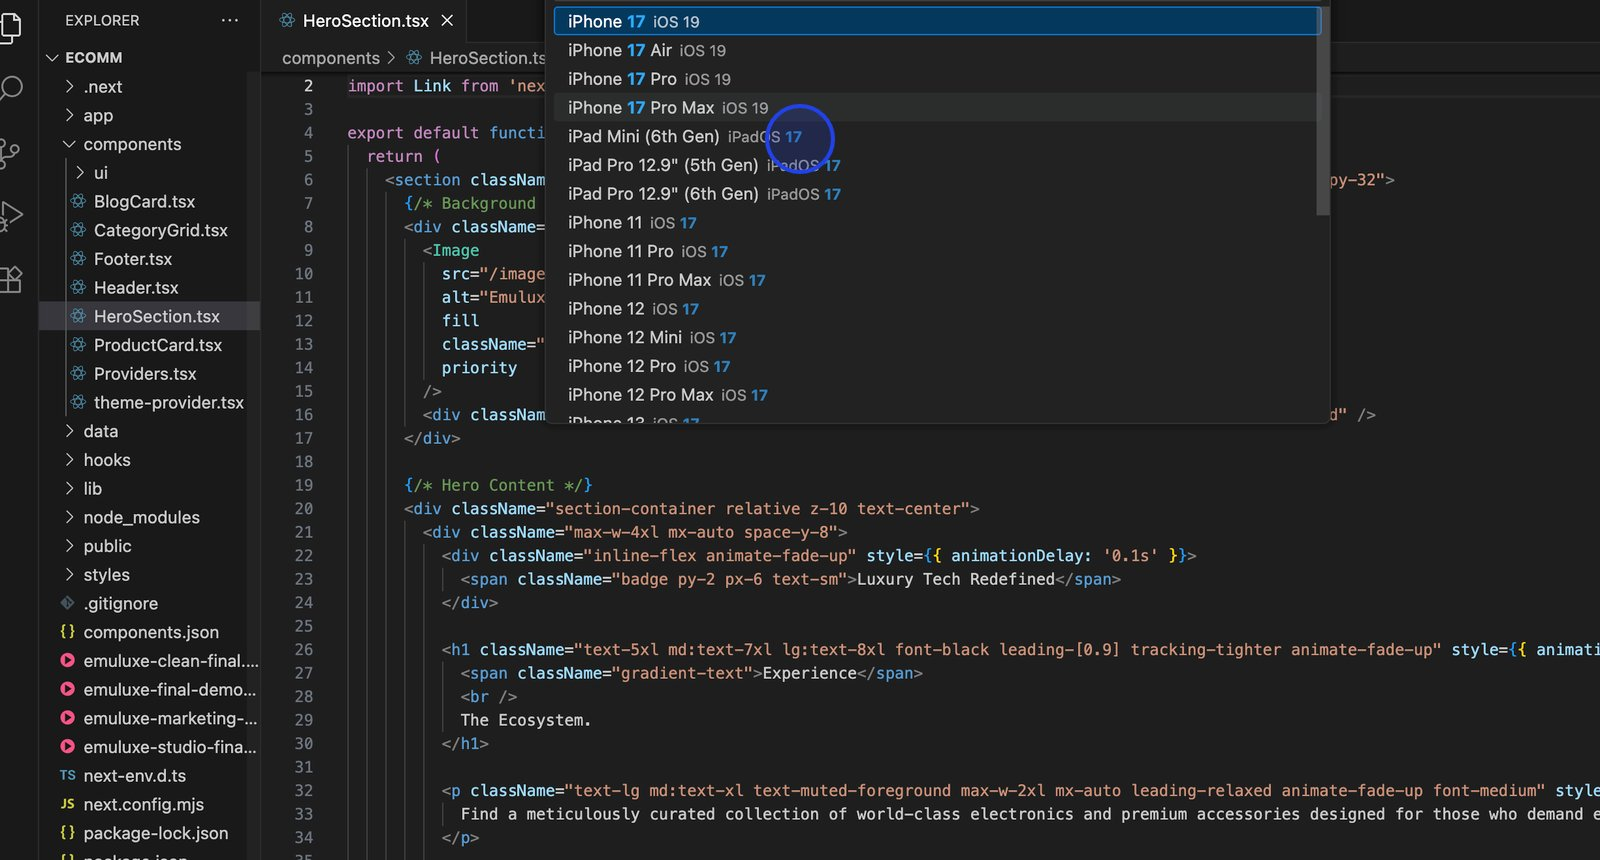
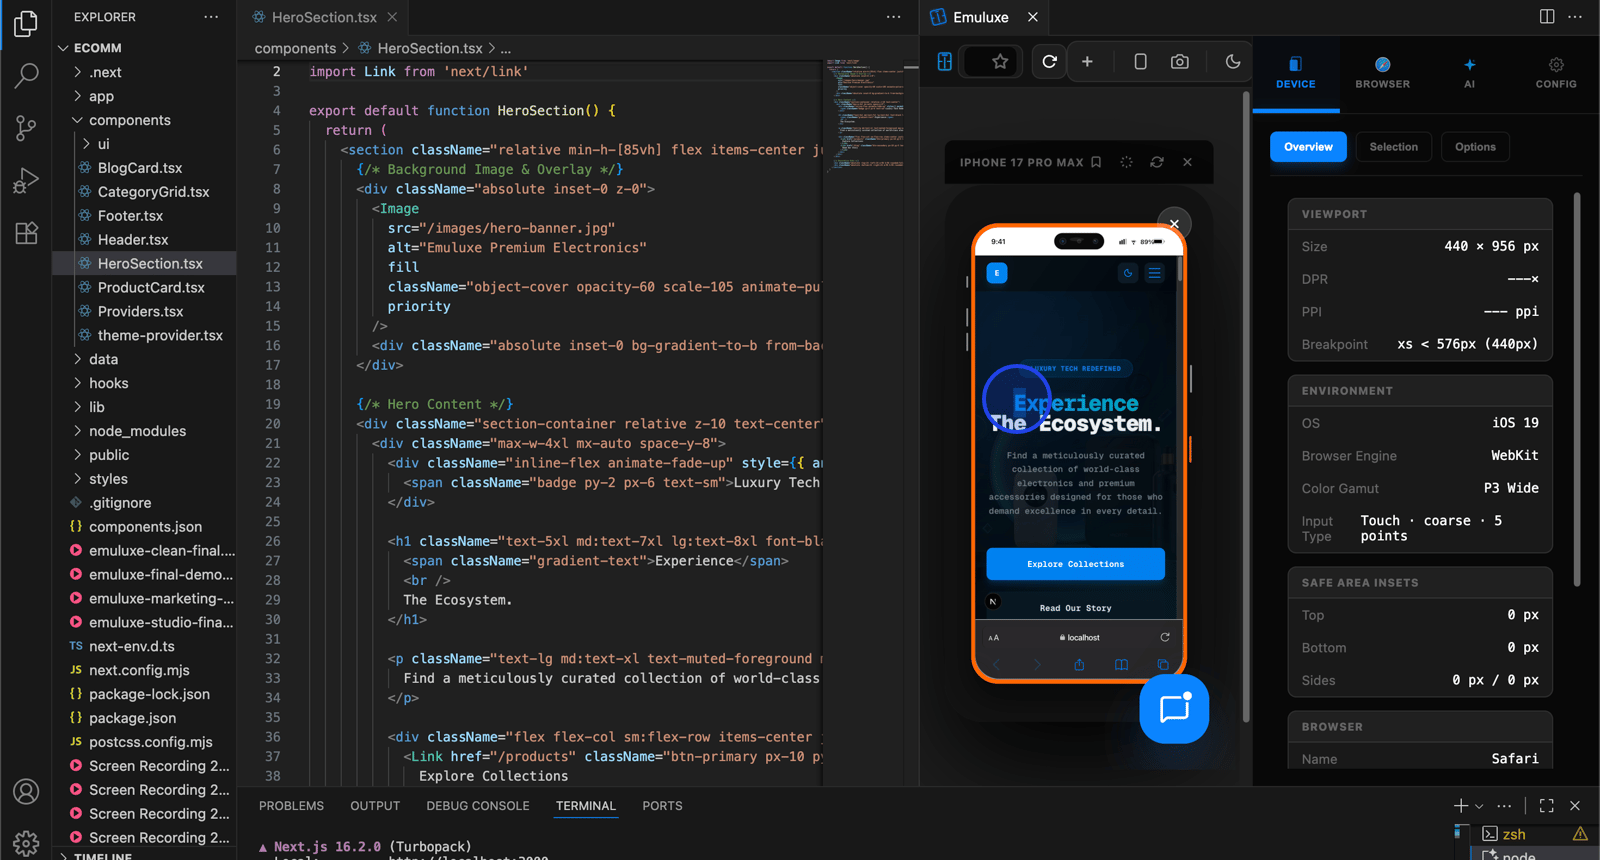
Step 6: Device Selection and Customization
Once simulation is running, you can customize the device configuration:
- Change Device: Press
Cmd+Alt+Dto open the device quick-pick - Available Devices: Choose from 30+ device profiles including:
- iPhone series (SE, 14, 15, 15 Pro, 15 Pro Max)
- iPad series (mini 6, Pro 12.9, Air)
- Android flagships (Pixel 8 Pro, Galaxy S24 Ultra, OnePlus 12)
- Android mid-range (Galaxy A54, Pixel 7a)
- Android budget (Redmi Note 13, Moto G Power)
- Foldables (Galaxy Z Fold 6, Pixel Fold)
- Desktop profiles (MacBook Pro, Windows Laptop, 4K Display)
Step 7: Advanced Simulation Features
Orientation Toggle
- Press
Cmd+Rto instantly toggle between portrait and landscape modes - The simulation maintains your current state during rotation
- Layout shifts and responsive behaviors are immediately visible
- Note: This shortcut may conflict with VS Code's reload command; customize if needed
Screenshot Capture
- Press
Cmd+Swhile simulation is active - A high-fidelity screenshot is captured including:
- The device frame and bezels
- The rendered website content
- Current orientation and device state
- Screenshots are saved to your default downloads folder
- File naming includes timestamp and device information
Developer Inspector
- Press
Cmd+Ito open the Chrome DevTools inspector - Debug your application using standard Chrome DevTools features
- The inspector operates within the simulated mobile environment
- Inspect elements, view console logs, and analyze network activity
- This provides the same debugging experience as native mobile browsers
Biometric Simulation
- Navigate to a page with WebAuthn or biometric authentication
- The extension intercepts biometric API calls
- Simulated FaceID/TouchID prompts appear for testing
- Test both success and failure scenarios for comprehensive coverage
- This feature requires a Pro or Enterprise subscription
Step 8: Network Simulation
- Access the network controls from the simulation panel
- Select from pre-configured network profiles:
- 4G: Typical mobile broadband (10 Mbps download, 5 Mbps upload)
- 3G: Slower mobile connection (1.5 Mbps download, 750 Kbps upload)
- 2G: Edge/GPRS (250 Kbps download, 50 Kbps upload)
- Offline: No network connectivity
- Custom profiles can be created for specific testing scenarios
- Network conditions affect:
- Page load times
- Resource loading sequences
- JavaScript execution timing
- API request/response patterns
Step 9: Session Management
- Use the session controls to save your current simulation state
- Saved sessions include:
- Device configuration
- Network conditions
- Cookie and local storage state
- Current URL and scroll position
- Share sessions with team members for collaborative debugging
- Export sessions for offline analysis or documentation
- Session features require Pro or Enterprise subscription
Step 10: Plan Enforcement
The extension automatically enforces feature access based on your subscription tier:
- Free Tier: Basic viewport resizing, 6 devices, 3 AI analyses per day
- Pro Tier: 30+ devices, unlimited AI, sessions, advanced features
- Enterprise Tier: All Pro features plus team sharing, SSO, audit logs
No manual configuration is required—the extension detects your tier and enables features accordingly.
Troubleshooting
Login Issues
Problem: Authentication fails or token is rejected
Solutions:
- Verify you have an active Emuluxe account at emuluxe.com
- Check your internet connection
- Try clearing VS Code credentials: Run
Emuluxe: Logoutthen login again - Ensure your token hasn't expired (30-day validity period)
- Contact support if issues persist
Simulation Not Starting
Problem: Extension doesn't launch simulation panel
Solutions:
- Verify your token is correctly configured in Settings
- Check that your development server is running on a detected port
- Try restarting your IDE after installation
- Check the IDE's output panel for error messages
- Ensure your IDE meets the minimum version requirements
Smart Discovery Not Finding Servers
Problem: Local servers aren't detected automatically
Solutions:
- Confirm your development server is actually running
- Check that your server uses a standard port (3000-5173 range)
- Manually enter the URL in the simulation interface
- Check firewall settings that might block port scanning
- Restart the extension by reloading your IDE window
Keyboard Shortcuts Not Working
Problem: Shortcuts don't trigger expected actions
Solutions:
- Some shortcuts may conflict with IDE defaults or other extensions
- Customize shortcuts in: Settings > Keyboard Shortcuts > search "Emuluxe"
- Check that the simulation panel has focus when using shortcuts
- Verify you're using the correct modifier keys for your OS
- Try alternative access methods (toolbar, context menu, command palette)
Device Frames Not Displaying
Problem: Simulation runs but device frames are missing
Solutions:
- Ensure you have a Pro or Enterprise subscription (frames are a paid feature)
- Check that hardware acceleration is enabled in your IDE
- Update your graphics drivers
- Try switching to a different device profile
- Check the output panel for rendering errors
Integration with AI Agents
Cursor Integration
The Emuluxe extension provides Cursor's AI assistant with hardware-aware context:
- Cursor can "see" your site through specific device geometries
- AI suggestions account for device-specific constraints (safe areas, notches)
- The assistant can recommend device-optimized code changes
- Real-time validation of AI-generated code against 80+ device profiles
Antigravity Integration
Antigravity agents gain direct access to hardware fingerprints:
- Agents can verify code changes against simulated devices in real-time
- Automated testing across multiple device configurations
- Hardware-aware code generation and optimization
- Integration with Antigravity's advanced AI capabilities
Claude Integration
Claude Desktop and Claude Code CLI provide plan-aware routing for Emuluxe:
- Free tier users receive CLI commands for simulation
- Pro/Enterprise users get platform dashboard access
- MCP server automatically detects environment and plan tier
- Seamless integration with Claude's AI capabilities
Windsurf Integration
Windsurf's Cascade AI system integrates with Emuluxe for agentic development:
- Native VS Code extension support in Windsurf IDE
- Deep link scheme: windsurf:// for in-IDE simulation
- Cascade MCP server integration for AI agents
- Same seamless experience as VS Code and Cursor
MCP Server Integration
For advanced AI workflows, the extension works with the Emuluxe MCP Server:
- Install the MCP Server:
npx -y @emuluxe/mcp-server - Configure your IDE's MCP settings with your EMULUXE_TOKEN
- AI agents can programmatically launch simulations
- Automated testing and validation workflows
- Deep-link integration for seamless simulation launching
Best Practices
Development Workflow
- Start Early: Use simulation from the beginning of development, not just at the end
- Test Multiple Devices: Verify your site across different device categories
- Test Network Conditions: Don't assume fast, reliable connections
- Use Sessions: Save interesting states for later analysis
- Leverage AI: Use AI analysis to catch issues you might miss
Performance Optimization
- Close Unused Simulations: Multiple active simulations can impact performance
- Use Appropriate Devices: Test with devices relevant to your target audience
- Monitor Resource Usage: Check your IDE's resource usage during simulation
- Cache Sessions: Reuse saved sessions instead of recreating configurations
Team Collaboration
- Share Sessions: Export and share sessions with team members
- Document Issues: Use screenshots to document mobile-specific bugs
- Standardize Testing: Agree on a standard set of devices for team testing
- Use Enterprise Features: Leverage team sharing and audit logs for large teams
Security and Privacy
- Data Collection: Only anonymous usage analytics and authentication tokens are collected
- Source Code Privacy: Your source code never leaves your local machine
- Secure Storage: Tokens are stored in your IDE's secure credential storage
- Encrypted Communication: All dashboard communication uses HTTPS
- Token Expiration: Tokens expire after 30 days for security
- No Remote Code: The extension does not execute remote code
Next Steps
After completing the setup:
- Explore the Command Palette for advanced commands
- Learn about AI Analysis for automated issue detection
- Configure Network Throttling for realistic testing
- Set up Session Management for collaborative debugging
- Explore Biometrics Simulation for authentication testing
For additional help, visit the Help Center or contact support@emuluxe.com.