Devtools Panel
The Emuluxe Devtools Panel provides an integrated suite of diagnostics and controls that live alongside your simulated website. It is designed to mimic the familiarity of Chrome DevTools while adding mobile-specific capabilities.
Panel Sections
- Device: Control physical hardware specs, orientation, and fold states.
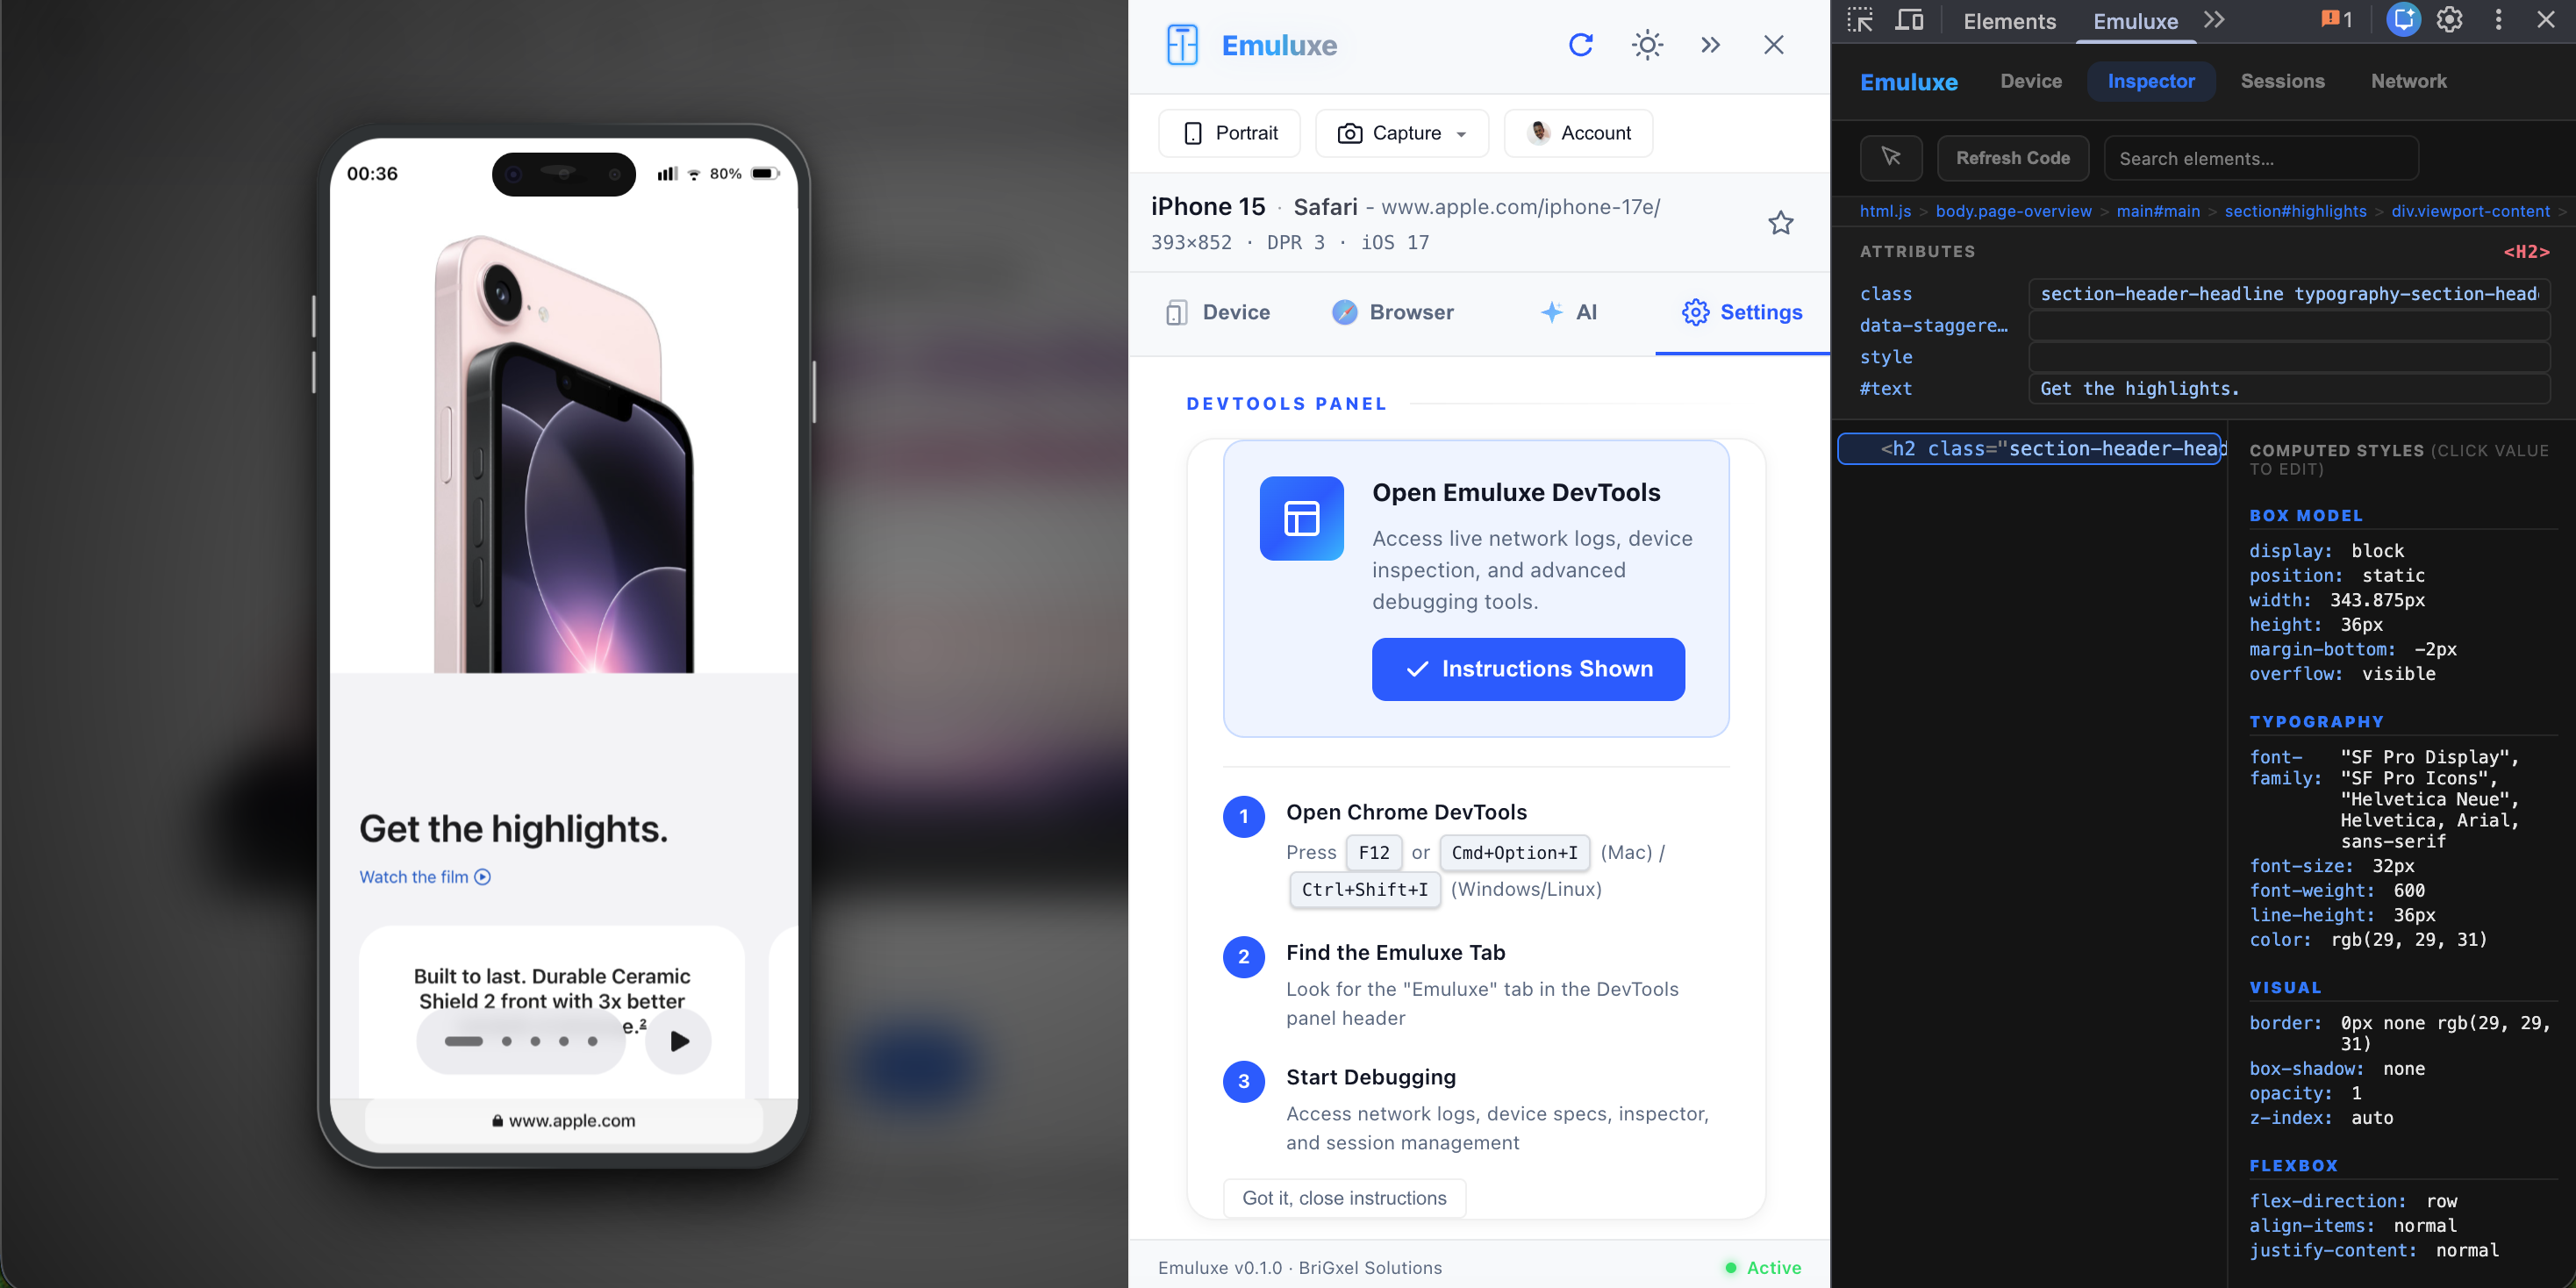
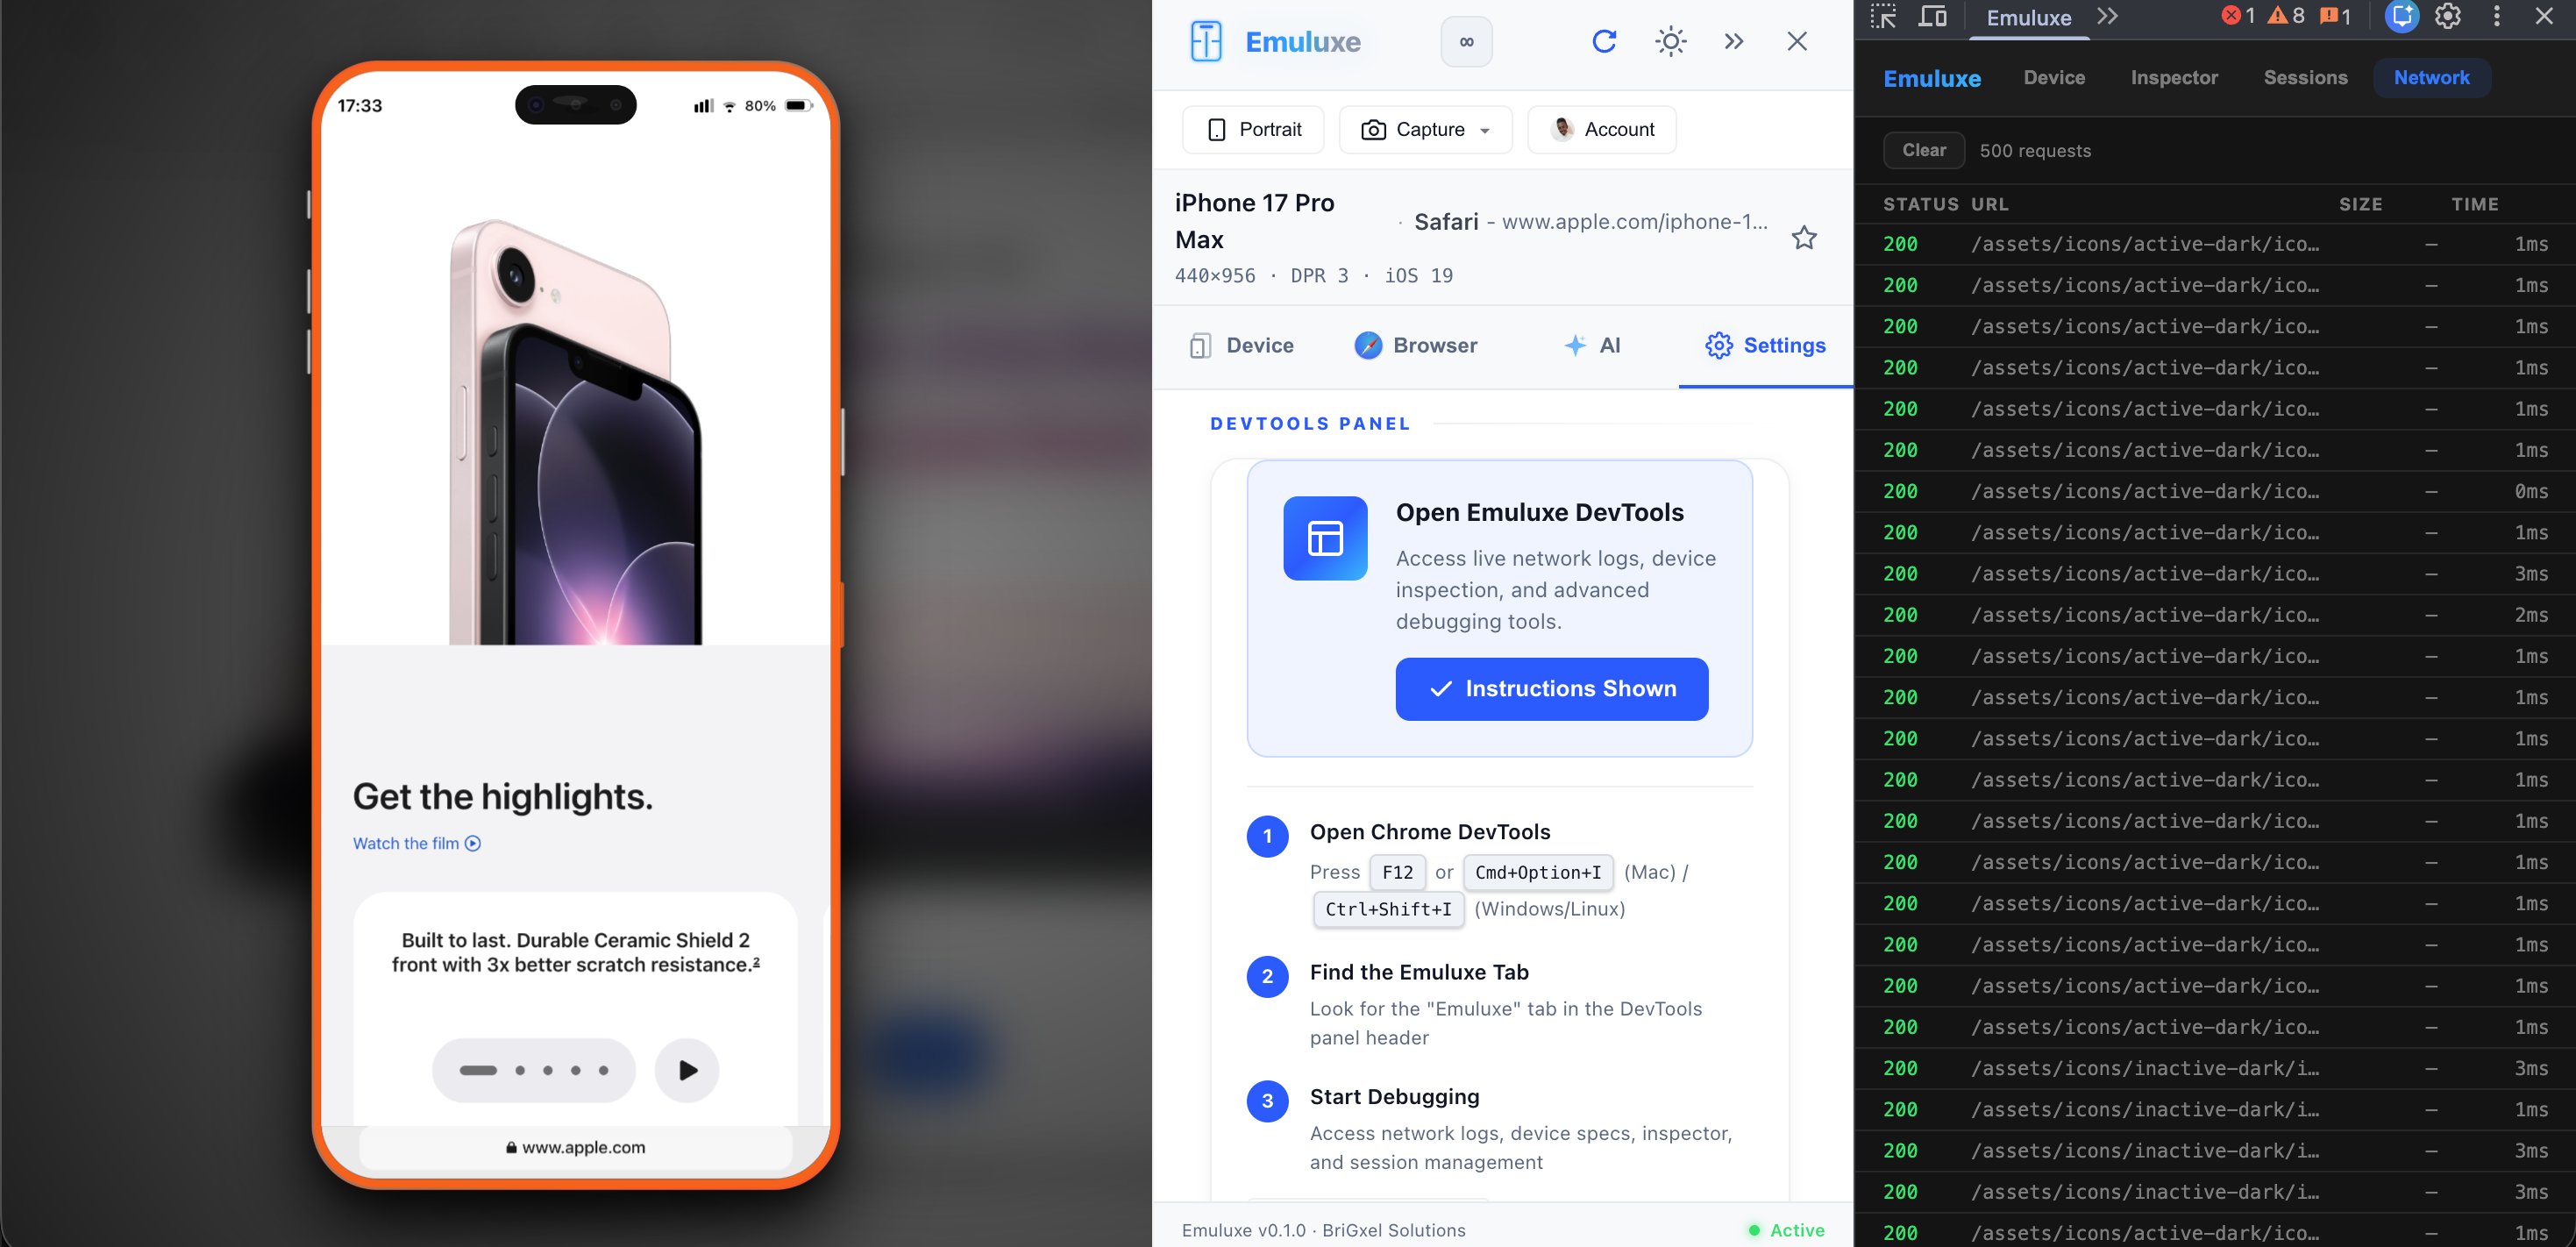
- Network: Apply throttling profiles, view download speeds, and manage custom rules.
- AI: Run full-site audits, view recommendations, and chat with the Emuluxe AI about specific code issues.
- Settings: Configure simulator behavior, including safe-area debugging and touch-event mirroring.
Mobile-Specific Tools
- Safe Area Debug: Toggles a visual overlay that shows exactly where the device's hardware (notch, rounded corners) overlaps with your web content.
- Coordinate Overlay: Displays the current X/Y touch coordinates in real-time, helping you debug tap-target issues.
- DPR Scaling: Unlike standard windows, the panel shows your site at the device's true Device Pixel Ratio, helping you spot low-resolution assets.
How to use
The Devtools Panel is the default interface when you activate the Emuluxe extension. You can maximize, minimize, or move it to any side of your browser viewport using the controls in the panel header.